Both stocks and bonds produced positive returns in the fourth quarter, the only positive quarter of 2022 for both asset classes. Facet portfolios largely performed better than the broad market due to a combination of being overweight value stocks, corporate bonds, and municipal bonds.
Here are our thoughts on what happened this quarter and how it impacted Facet portfolios.
Model Portfolio Performance1
| 4Q 2022 | YTD 2022 | 3YR | Inception | |
| Facet Equity | 11.57% | -13.73% | 4.79% | 9.59% |
| Equity Benchmark2 | 9.97% | -18.31% | 3.76% | 8.97% |
| Facet Bonds (Tax-Deferred accounts) | 2.15% | -14.10% | -3.37% | -0.16% |
| Facet Bonds (Tax paying accounts) | 3.07% | -9.65% | -1.68% | 0.62% |
| Bond Benchmark3 | 1.84% | -12.99% | -2.73% | 0.00% |
(The portfolios listed above, Facet Equity and Facet Bonds, represent the equity and fixed income portions of the models a client may invest in but are not necessarily stand alone portfolios. For example, if a client were in a portfolio that was balanced 70/30 between equity and fixed income, the Facet Equity model return would be the return for that portion of the overall model only).
Light at the End of the Inflation Tunnel
Inflation, and the Federal Reserve’s response to inflation, has been the dominant story in markets for all of 2022. Fear that the Fed’s aggressive rate hiking could cause a recession has been a major reason why stock prices have fallen most of this year.
This quarter brought some relief on the inflation front. According to the October and November Consumer Price Index reports, inflation has started to slow. Based on the details of the reports, we think there is good reason to believe inflation could keep slowing in the coming months. If so, it could mean the Fed is close to the end of this rate hiking cycle. In fact, in their most recent meeting, the Fed chose to slow the pace of rate hikes and signaled that the pace could slow even further in the coming months.
We have been saying for a while that one necessary step for the 2022 bear market to end would be some clarity on how high the Fed would ultimately hike rates. This quarter proved that point, as stocks reacted very positively to slower inflation data and less aggressive signals from the Fed.
Cyclical Sectors Outperform Tech, Consumer
Most companies reported relatively strong earnings during the fourth quarter, which also helped fuel the stock market rally. According to Bloomberg data, 73% of S&P 500 reported profits better than analyst expectations this quarter.
Notably, a disproportionate share of the misses came from companies in the technology and consumer sectors. One major reason why inflation has cooled is that consumer spending has slowed considerably. Hence we saw companies like Amazon, Walmart, and Target all warn of weaker profits. In addition, spending on cloud computing services and online advertising appears to be slowing as well. Companies like Microsoft, Alphabet (parent of Google), and Meta (parent of Facebook) were impacted by these factors this quarter.
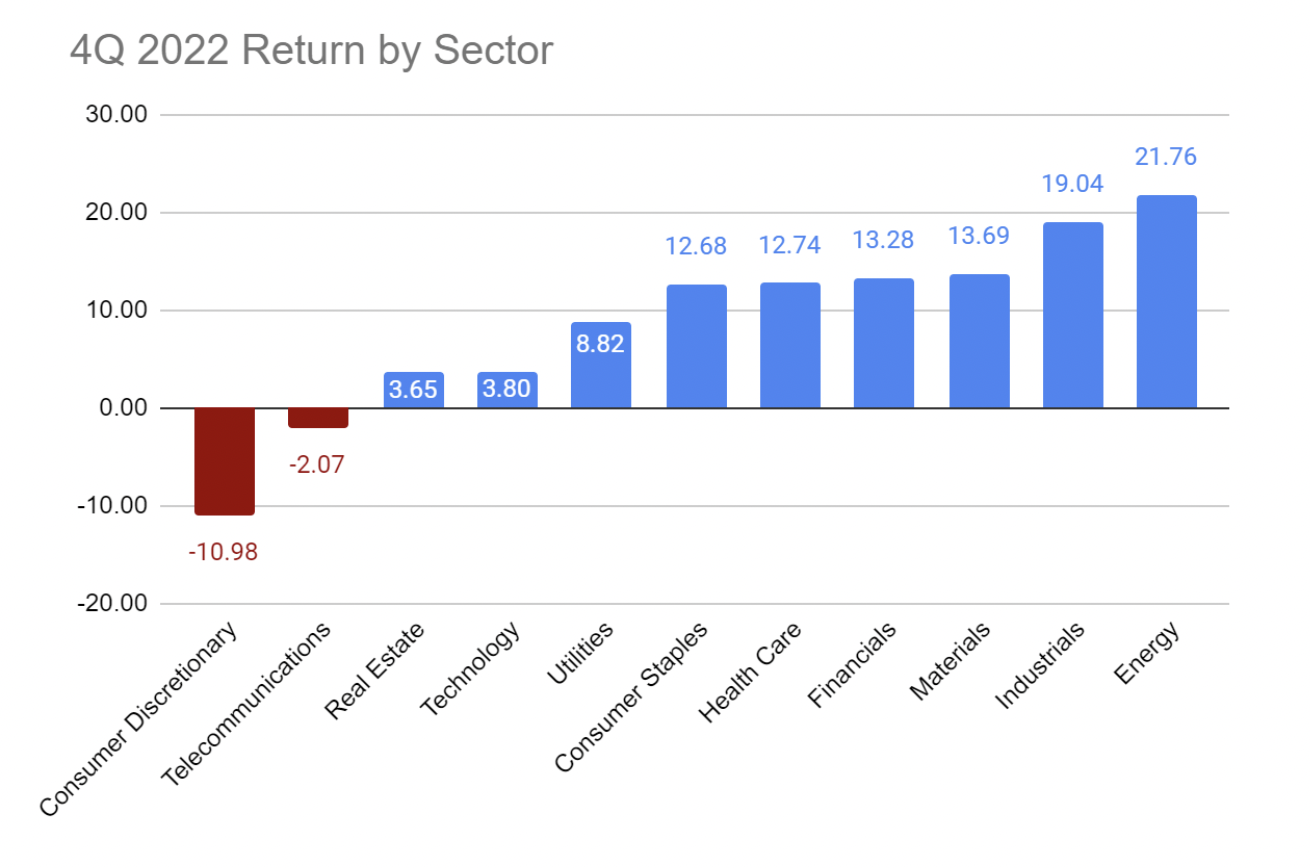
Meanwhile, traditionally cyclical companies, i.e., companies whose profits are especially sensitive to the macroeconomic cycle, were among the best performers. This includes materials, industrials, and energy.
The relatively strong performance of these sectors reflects some optimism about the macroeconomy. Falling inflation eases pressure on the Fed to keep hiking rates, which in turn could make a recession less likely and/or less severe. This probably buoyed the returns of these more cyclical sectors.
International Stocks Outperformed the U.S.
Non-US stocks broadly outperformed their domestic counterparts this quarter, driven primarily by developed countries. Developed Europe returned just over 19%, and developed Asia just over 14%. Notably, most of this return was in currency translation. When US investors buy a non-US stock, even if it is inside of an ETF, the purchase occurs in the local currency. This means that part of your return depends on the exchange rate between the US dollar and the foreign currency. If the foreign currency appreciates, it makes the foreign stock more valuable in US dollar terms, all else being equal.
During the fourth quarter, most developed market currencies strengthened vs. the US dollar. This means that investors who bought stocks in other currencies got a performance boost when their returns were translated back into US dollars. For example, according to Bloomberg, Eurozone stocks returned 13.0% during the 4th quarter—but given the appreciation in the euro—that translated to 23.6% for a US dollar-based investor. This effect was strongly positive for all the major developed currencies. The chart below shows currency movement for the largest non-US dollar currencies in the world stock markets. Developed countries are in blue and emerging in orange.
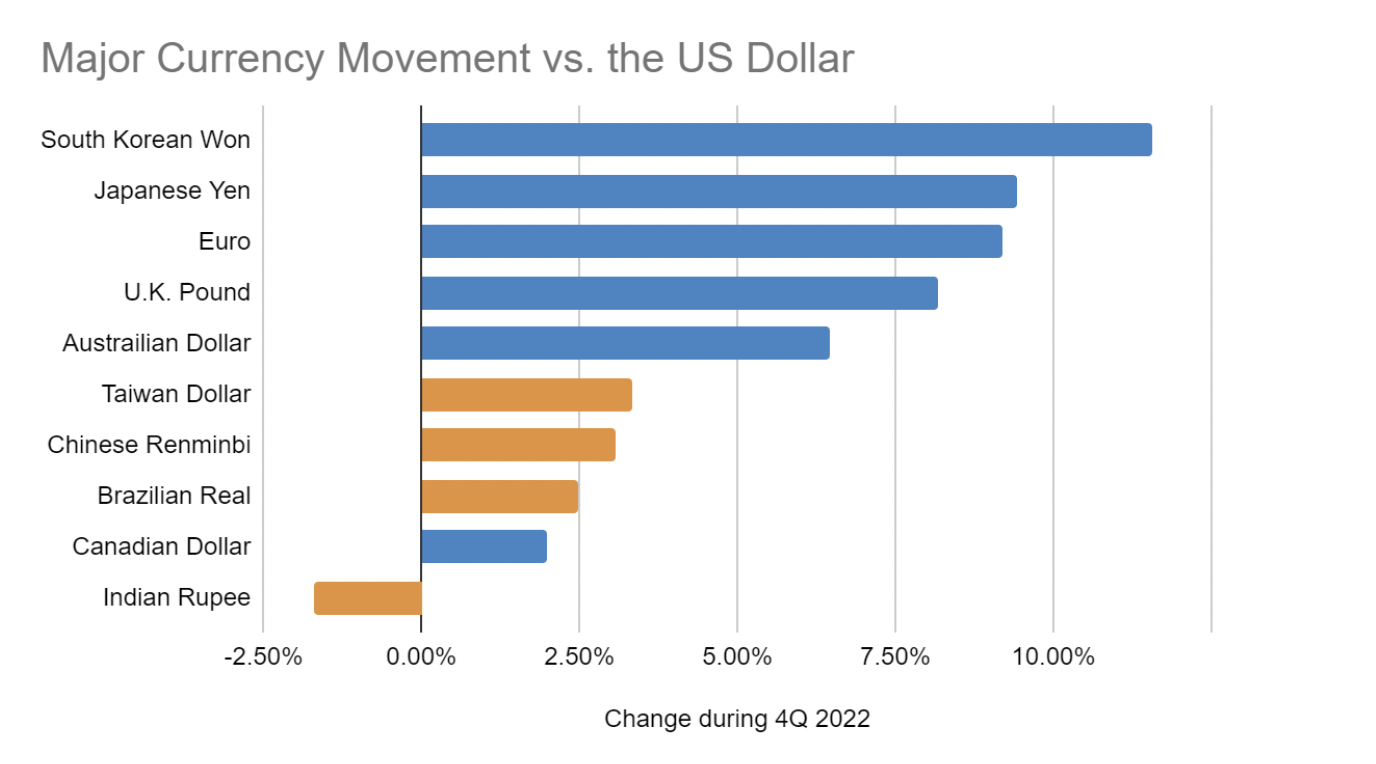
As the chart implies, emerging markets did not have this currency boost effect and, as a result, wound up performing about the same as the US.
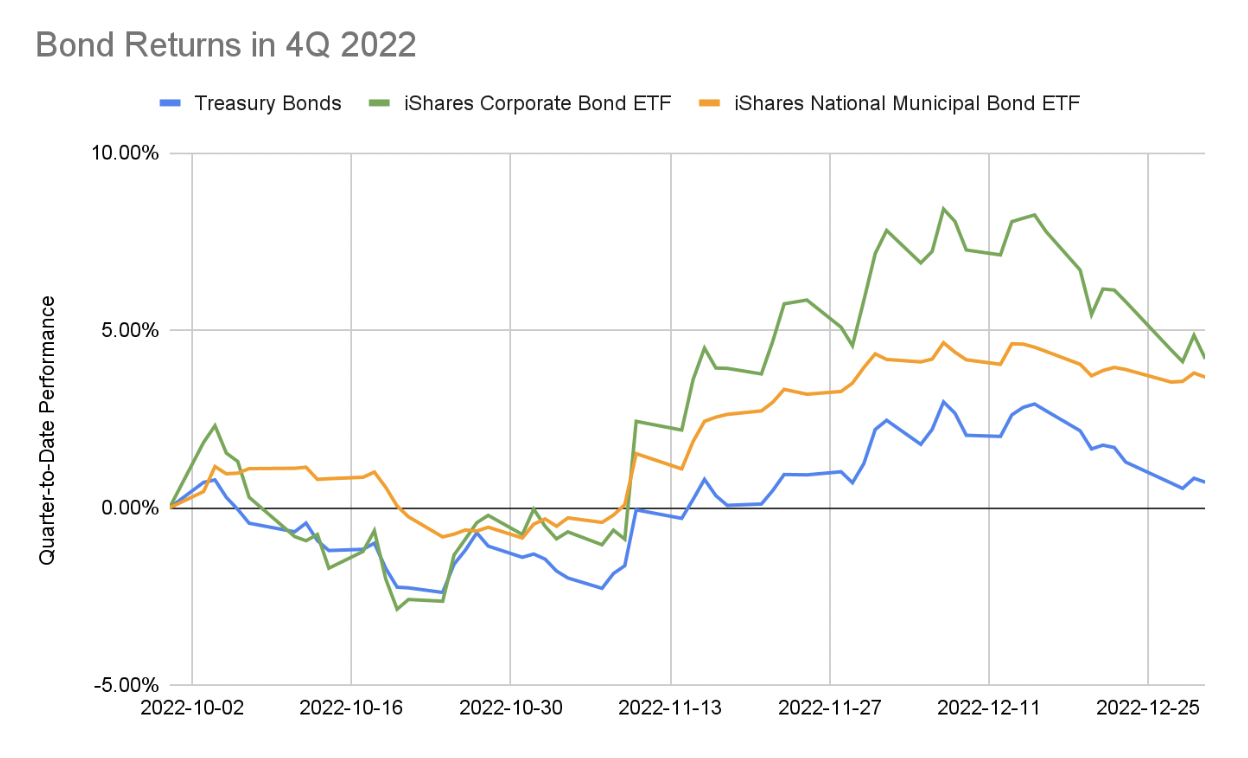
Treasury Bond Returns Lag Other Bond Types
The yields on Treasury bonds wound up little changed for the quarter, but that belies significant volatility. The 10-year Treasury yield rose as high as 4.24% in late October, then fell as low as 3.42% in early December before finally finishing at 3.88%. This was just 0.05% higher in yield than at the start of the quarter.
While Treasury rates get all of the attention, other types of bond yields are more important for many investors. This quarter the yield on corporate bonds4 fell by 0.26%, which helped boost the returns of corporate bonds. The iShares Investment Grade Corporate Bond ETF, a fund Facet often uses to gain exposure to corporate bonds, returned 4.20% this quarter, far ahead of the 0.72% return for Treasury Bonds5 in general.
Similarly, the yields on municipal bonds6 fell by 0.50%, which also helped drive that sector to perform well. The iShares National Municipal Bond ETF returned 3.68% this quarter. So despite the fact that Treasury rates were mostly unchanged, for most bond investors, it was a pretty good quarter.
Facet vs. Benchmark
Entering the fourth quarter, Facet was overweight “value” stocks and underweight “growth” stocks. (Value stocks tend to have lower prices than the company’s current earnings or asset value and slower profit growth than growth companies). We were also overweight smaller companies vs. larger companies compared to the market as a whole.
Continuing a trend that has been evident all year, value companies outperformed meaningfully this quarter. The chart below shows the performance of various buckets of US companies between value and growth, as well as smaller and larger companies7.
| Value | Growth | |
Larger Companies | 12.40 | 2.19 |
Smaller Companies | 8.39 | 4.11 |
Being overweight value vs. growth was a big benefit to performance this quarter and all of 2022. This is the biggest single driver of Facet’s returns in equity ETFs, generally a bit higher than the broad market during this quarter and all of 2022.
In fixed income, Facet’s overweight of corporate bonds in our tax-deferred accounts and municipal bonds in tax-paying accounts was a significant benefit. Moreover, as mentioned above, these two sectors outperformed Treasury bonds substantially during the fourth quarter.
Looking Forward
Inflation and interest rates were the dominant force in financial markets during 2022. It was a significant reason value outperformed growth, currencies were so volatile, and bonds had such historically poor performance.
We do not expect interest rates to be as dominant of a factor in 2023. The economy is likely to slow down by some degree, which should help get inflation to subside and allow the Fed to stop hiking interest rates eventually. Whether that means that Treasury rates rise or fall over the whole year is difficult to say, but it probably means they won’t persistently increase as they did in 2022.
If the economy does slow, markets could become more focused on how the slowing economy impacts company profits. Accordingly, during the fourth quarter, we changed our ETF allocation to increase exposure to companies with higher profit margins, less volatile profits, and lower debt burdens than the average company.
Companies with relatively high profit margins tend to have fewer competitors and/or a more differentiated product for which customers are willing to pay more. Because of this, they are better positioned if inflation were to continue being a problem. We also think these companies will see more stable revenue than others if the economy slows down. This is because of their lack of competitors and/or the distinctiveness of their product.
By less volatile profits, we mean companies whose profits don’t change as much as other companies quarter-by-quarter or year-by-year. Companies in this category generally sell products that their customers consistently need or for which there are few alternatives. This means they suffer less of a sales decline when the economy slows.
Lastly, companies with lower debt burdens could be beneficial in two ways. First, if interest rates stay high, these companies will face increasing interest costs. That increased cost lowers profits directly. Secondly, the more debt a company has, the less financial flexibility it has. A company must pay its debts, and a decline in profits during a recession could leave a company in dire financial condition. Companies with less debt have more cushion to withstand a challenging period.
We think having a bit more weight to companies like this positions our portfolios to perform relatively well in various scenarios, from a relatively benign slowdown to a full-blown recession. We do not know what 2023 will bring, but we believe this allocation is well-suited regardless of what happens.
Sources:
1Performance displayed is based on Facet’s base model portfolios for equity, tax-deferred fixed income and taxable fixed income. Actual client portfolio results may differ. See additional disclosures at the end of this article for more details.
2Equity benchmark is the Morningstar Global Markets NR USD index, which is net of dividends. See additional disclosures at the end of this document.
3Bond benchmark is the Morningstar U.S. Core Bond index. See additional disclosures at the end of this document.
4Yield on corporate bonds represented by the yield-to-worst of the Bloomberg US Investment-Grade Corporate index.
5Treasury bond returns represented by the Bloomberg US Treasury Index.
6Municipal bond yields represented by the yield-to-worst of the Bloomberg Municipal Bond Index.
7Large company performance based on Russell 1000 Value and Growth indices respectively. Small company based on the Russell 2000 Value and Growth respectively.