

The October employment report showed that the US only added 150,000 new jobs in the most recent month. That represents only half the job gains from September and was the second-weakest gain of 2023.
Meanwhile, the Unemployment Rate rose to 3.9%, the highest since January 2022. Perhaps somewhat surprisingly, though, stock prices surged on the news, with the S&P 500 reversing all of its October decline in just the first week of November.
So why is a weaker job market good news for stocks? And should we be worried that slower employment gains could become a negative trend? Here’s our take on the current state of the US labor market.
“Goldilocks” jobs report
The ideal economy can be described as a “Goldilocks” state. That is to say, not too hot, not too cold. Just right. In 2021 and 2022, we experienced an economy that was too hot, causing inflation to surge. Federal Reserve Chair Jerome Powell has repeatedly said that high inflation results in an economy that “does not work for anyone.” Investment markets agreed in 2022, with both stocks and bonds posting sharply lower returns.
This is why the markets have cheered slower job growth in 2023. In 2021-2022, the US economy added 503,000 jobs per month on average. Based on how high inflation got during this period, we can conclude that 503,000 is too hot. Over the last six months, the economy has added an average of 207,000. Given that inflation has been declining in 2023, it might be that 207,000 is just right.
History backs this up. The chart below shows rolling six-month US job gains measured in percentage growth from 1984 to today. We use rolling periods since they help smooth out some of the month-by-month variations, and we use percent growth since it makes it easier to compare time periods given general population growth.
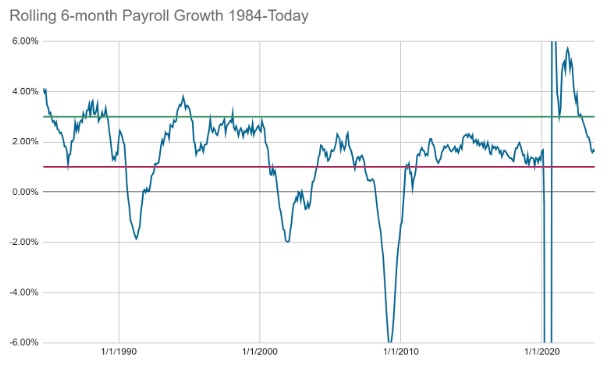
Looking at this chart, you notice that the vast majority of the time, we see employment growth at an annual rate between 3% (green line) and 1% (red line). We see the one period where job growth was far in excess of this range (2021-2022) when we suffered inflation. We also see that almost every time job growth has fallen below this range, it has kept falling into negative territory, and there’s been a recession.
We have shown this chart a few times over the last couple of years because it is a good illustration of this Goldilocks concept. We want payroll gains to fall right in that middle zone between 1% and 3%. That’s a sustainable path that neither leads to recession or inflation.
At the end of the chart, that’s right where we are. In the last six months, job gains have come at an annual rate of 1.59%---dead in the middle of the Goldilocks zone.
Beware the outlier data point
One reason why markets cheered this slower October jobs report was because September’s had been so strong. At the time, there was some worry that the economy might be accelerating again, perhaps to the point that inflation could rebound.
However, even at the time, the 336,000 job gain for September seemed anomalous. Other data points, including job openings, wage growth, and average hours per week, showed no signs the labor market was tightening. As we mentioned in our commentary, private job search sites like LinkedIn and Indeed have been reporting declines in job listings.
Just about all macroeconomic data has its quirks. Everything from one-off fluctuations to measurement errors to seasonal effects can cause any one data release to give a false signal. Looking at this payroll release, September wasn’t even the only time this year where there’s been a big outlier in the initial report.
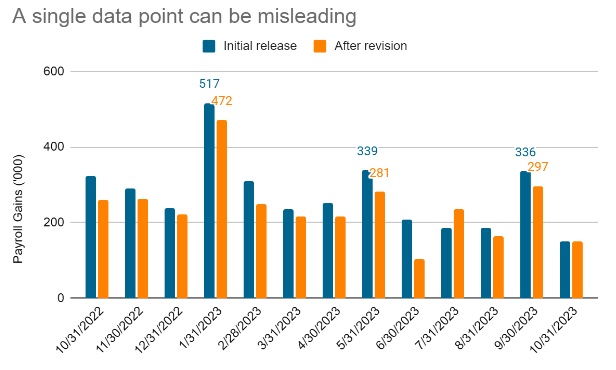
With the benefit of hindsight, the January, May, and September payroll gain figures all look like outliers. Not only do they stick out compared to the other nearby months, but they were also all subsequently revised downward. However, at the time, each of these large upside reports caused the market to worry that the labor market was tightening up and, consequently, that inflation could rebound.
In reality, what this example proves is that you just can’t trust any single piece of economic data. You need to treat economic analysis like a puzzle with a lot of pieces. If there indeed is a new trend forming, that should be evident in several different data points, not just one.
For example, when we analyzed the big spike in January, we pointed out that no other measure showed the labor market strengthening, and similar to September, we were skeptical that the January surge would last. Indeed, it did not.
Could the slowing become a trend?
For the moment, job gains have slowed from the red-hot pace of 2021-2022 to a much more normal pace. However, it is worth asking what happens if this slowing trend continues. For the US to have a Goldilocks economy, job gains have to be not too hot or cold.
While it is possible job gains could continue to slow, we aren’t seeing much evidence that companies broadly are cutting headcounts. For example, the chart below compares the last two years worth of Initial Jobless Claims. This represents the first time someone applies for unemployment insurance after losing their job. The orange line represents today, while the purple and blue lines show the 24 months leading up to the 2001 and 2008 recessions, respectively. I.e., the last point on the chart is the month the recession officially began.
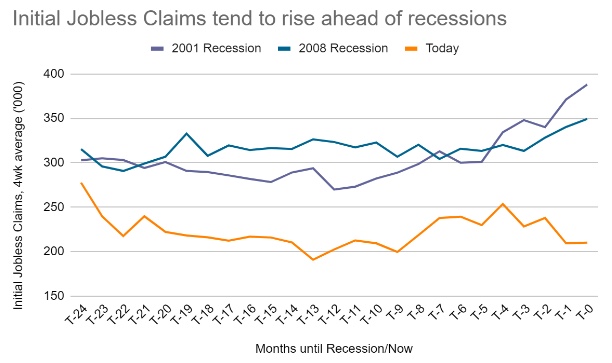
What we see is that today, about 200,000 people are applying for unemployment each week, and that has been fairly steady over the last year or so. Looking at the months leading up to those recessions, we see that jobless claims started to rise about 6-12 months before the recession actually hit.
In addition, as an absolute number, today’s jobless claims are a lot smaller than they were in either of those prior periods, despite the fact that the total labor force has grown by about 25 million people since 2001. As a percentage of the labor force, today’s jobless claims are approximately at an all-time low.
What this suggests is that while companies aren’t hiring as aggressively as they were a year ago, they also aren’t laying people off. Again, this speaks to a Goldilocks labor market. The level of labor demand is just right vs. the level of labor supply.
Market reaction
What a difference a week makes. As of Friday, October 27, the S&P 500 was down 3.90% quarter-to-date. The following week, after the Fed suggested it might be done hiking rates and this tepid jobs report, stocks surged nearly 6% in just one week.
There are two big reasons why stocks jumped so much this week. The first is that the Fed taking pressure off the economy makes a soft landing more likely. A year ago, many feared that the only way the Fed would get inflation under control was to hike rates until they caused a recession. Powell himself suggested such a possibility many times. Now, it seems that inflation is well on its way to normalizing, while a recession is nowhere in sight. All of that is great news for the stock market.
The other reason is the decline in long-term interest rates. After hitting 5% in October, the 10-year Treasury yield has fallen over 0.4% to 4.57% as of November 3.
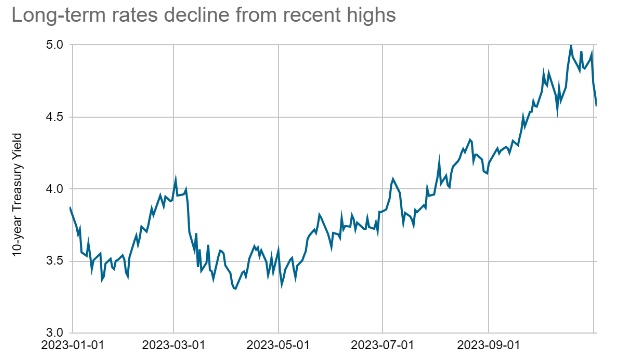
This has had a direct effect on returns for bond investors. The Morningstar US Core Bond index has risen 3.0% since rates peaked on October 19 and is now down less than 1% year-to-date. But somewhat lower interest rates matter for stock investors as well.
Longer-term interest rates are what matter most for a wide variety of borrowing, including everything from big businesses looking to expand to individuals borrowing to buy a home. For this reason, ever-higher interest rates put a crimp on this kind of economic activity.
While we think interest rates will remain higher than they were for most of the last decade, it would be beneficial for investors to get some stability in the bond market. Exactly what that means for where longer-term bond yields end up is hard to say. But if inflation stays on its downward trend, there will be no reason for the Fed to hike again, and that should mean that this upward trend in longer-term bond yields should be mostly over.