

Key takeaways
- The U.S. is not currently in a recession, though Q1 2025 showed negative GDP growth for the first time since early 2022.
- Recessions are normal parts of economic cycles, occurring roughly every 6-10 years.
- To recession-proof your finances, build emergency savings, reduce high-interest debt, and stay invested with a long-term view during economic uncertainty.
With economic headlines growing increasingly concerning and inflation putting pressure on household budgets, many Americans are wondering, "Are we in a recession?" or "Is the stock market crashing?" The good news is that the U.S. is not currently in a recession.
This article breaks down what recessions are, examines current economic data, and provides practical steps to protect your finances regardless of what happens next.
- What is a recession?
- Key signs of a recession to watch for
- Is the U.S. currently in a recession?
- How has the government been responding?
- How to prepare for a recession
- Recession FAQs
- Take control of your finances, no matter the market
What is a recession?
Before we discuss current conditions, it's important to understand what economists mean when they talk about recessions.
Technical vs. practical definitions of recession
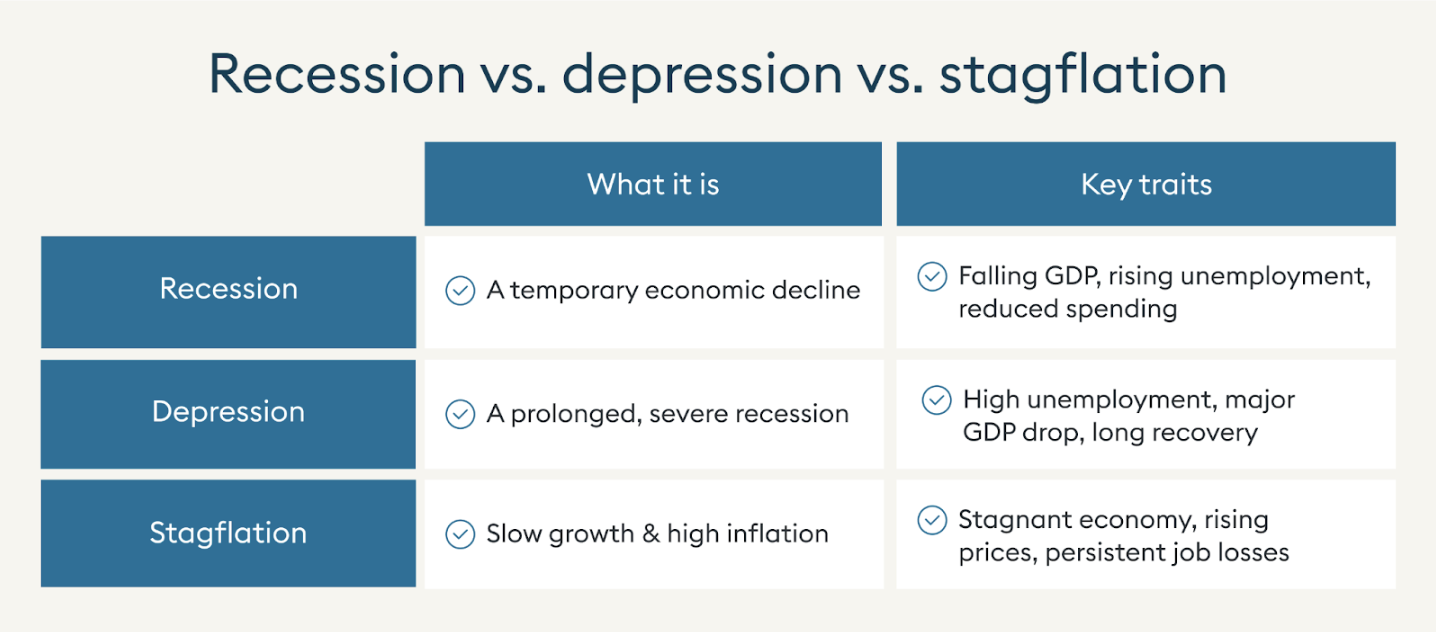
There are a few definitions of a recession. One is when there are two negative quarters of GDP growth in a row. However, most economists believe that this simple measure doesn't capture the full picture.
In reality, economists look at a broader set of indicators, including employment rates, personal income, consumer spending, and industrial production. This approach helps identify economic downturns that might not strictly meet the technical definition.
Keep in mind that not all recessions are created equal. Most recessions in recent decades have lasted anywhere from a few months to about two years, but their impact can vary dramatically. Some result in relatively modest increases in unemployment and economic disruption, while others are much more severe and far-reaching. This distinction matters because the policy responses, recovery timelines, and financial market outcomes can differ significantly based on the depth and breadth of the economic contraction.
Who declares a recession?
The National Bureau of Economic Research (NBER) is responsible for declaring recessions in the United States. Their Business Cycle Dating Committee analyzes economic data and announces when recessions begin and end, but these declarations typically come months after the fact.
That's why understanding real-time indicators matters more for your personal financial decisions than waiting for official announcements.
How often do recessions happen?
While U.S. recessions can feel alarming when they happen, they're actually normal parts of the economic cycle. The American economy has experienced a recession roughly every 6-10 years throughout its history. Here are some notable recent examples:
- Early 1990s recession: This was triggered by restrictive monetary policy aimed at controlling inflation, plus a spike in oil prices. Unemployment reached 7.8%, and the recession lasted about 8 months.[1]
- The 2001 Recession: This was triggered by the dot-com bubble burst and exacerbated by the September 11th attacks. The 2001 recession lasted several months, with unemployment rates reaching 4.8%.
- The Great Recession(2007-2009): This period was the most severe economic downturn since the Great Depression and was caused by the housing market collapse, with unemployment peaking at 10%.[2]
- The COVID-19 recession (February - April 2020): Though extremely short at just two months, this was the sharpest and most sudden recession in U.S. history. The unemployment rate increased from 3.5% to 14.7% in two months due to widespread lockdowns and global uncertainty.[3]
Key signs of a recession to watch for
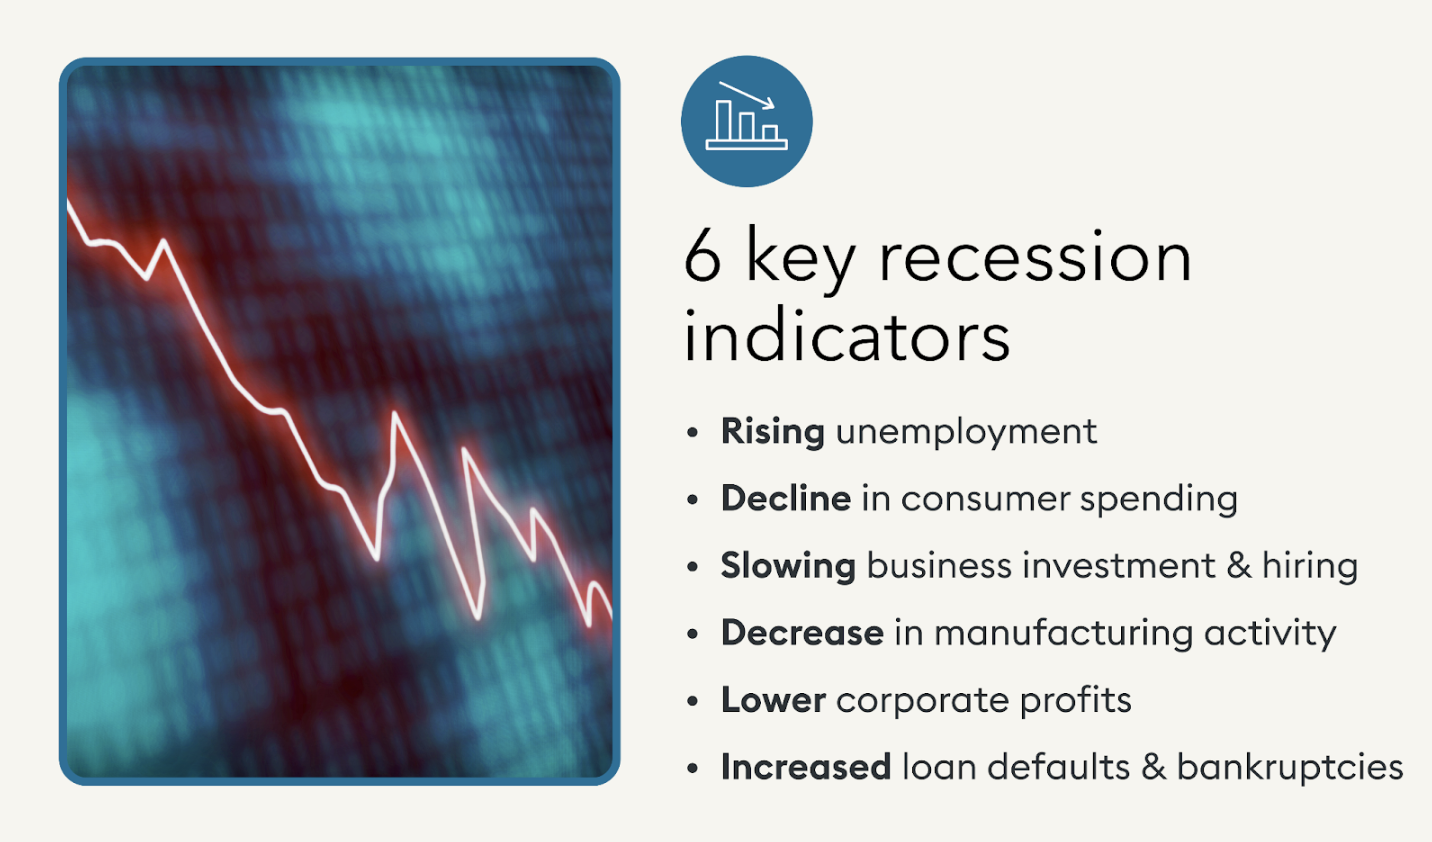
So, is the U.S. in a recession? Technically, you won't be told we're in one until it's too late to make any financial changes. What happens in a recession? While no single indicator guarantees a recession, several warning signs often appear when the economy is heading toward a downturn. These include:
- Rising unemployment: When companies start cutting jobs across multiple sectors, it often signals broader economic troubles. Watch for layoff announcements becoming more frequent across different industries.
- Decline in consumer spending: Consumer spending drives most of the U.S. economy, so when people start spending less on non-essentials, it can trigger a domino effect. Look for retail sales reports showing consistent drops over several months.
- Slowing business investment & hiring: When businesses delay major purchases or expansion plans, it often signals a lack of confidence in future growth. Companies tend to preserve cash during uncertain times.
- Decrease in manufacturing activity: Manufacturers typically reduce production before a recession sets in. This early warning sign reflects businesses anticipating slower demand for products.
- Lower corporate profits: When companies report declining earnings across multiple quarters and industries, it often precedes broader economic contraction. Pay attention to earnings season trends rather than individual company reports.
- Increased loan defaults & bankruptcies: When short-term government bonds have higher yields than long-term bonds, it has historically preceded recessions. This unusual situation suggests investors are pessimistic about long-term economic prospects.
Is the U.S. currently in a recession?
No, the U.S. is not currently in a recession. However, there are some concerning signs to watch. The most recent GDP report showed a slight contraction of 0.3% during the first quarter of 2025 — the first negative quarter since early 2022. Consumer spending behavior has become increasingly unstable, with consumer confidence declining for four straight months. Corporate earnings growth has also slowed considerably.[4]
Business activity
The business sector provides critical early signals about economic health through various metrics that measure production, manufacturing, and services.
GDP
Gross domestic product is the total value of all goods and services produced in a country. GDP contracted by 0.3% in Q1 2025, according to the Bureau of Economic Analysis's Advance Estimate.[4] This follows moderate growth in Q4 2024.[5] While one quarter of negative growth doesn't constitute a recession, it is a warning sign.
Manufacturing & services indexes
The ISM Manufacturing PMI (purchasing managers' index) is a monthly survey of manufacturing companies that measures expansion or contraction in the industrial sector. Above 50% indicates industrial expansion, while below 50% signals contraction. The Manufacturing PMI registered 48.7% in April 2025, indicating a modest contraction.[6]
Meanwhile, the ISM Services PMI measures similar expansion or contraction but for non-manufacturing businesses like retail, healthcare, and financial services, which make up the majority of the U.S. economy. The Services PMI stood at 51.6% in April, showing a slight expansion in the services sector.[7]
Business investment trends
How businesses invest their capital provides insight into their confidence in future economic conditions.
Capital expenditures (CapEx) reports track how much businesses are investing in physical assets like equipment, buildings, and technology. These investments are important because they represent companies betting on future growth. At the macro level, economists monitor total nonresidential fixed investment, which includes CapEx spending across the economy.
Healthy year-over-year growth in this category (typically 3-6%) is often seen as a sign of business confidence. The most recent data shows that investment in nonresidential structures is at $676.980 billion, with growth slowing compared to previous quarters.[8]
Small business sentiment offers another window into economic health. The NFIB Small Business Optimism Index decreased by 1.6 points in April 2025. At the same time, plans to make capital outlays decreased by 3 points.[9]
Consumer behavior
Consumption activity drives a significant portion of the U.S. economy, making consumer metrics crucial for understanding recession risk.
Retail sales data
The latest retail sales figures from May 2025 show a modest 0.1% increase in April compared to March. While this breaks the previous downward trend, the growth is minimal and within the margin of error. Looking at the bigger picture, sales are up 5.2% compared to April 2024, which sounds healthy but doesn't actually account for inflation.[10]
Digging deeper into the numbers shows us some recent patterns. Motor vehicle sales remain strong, and restaurants and bars continue to see robust spending. However, retail trade sales (excluding food service) actually declined 0.1% from March, suggesting consumers might be prioritizing experiences over goods.[10]
Consumer spending behavior
The Personal Consumption Expenditures (PCE) Price Index is the Federal Reserve's preferred inflation gauge, tracking how much consumers are spending and what they're paying for goods and services. Unlike the Consumer Price Index, the PCE gives a more comprehensive view by adjusting for changes in consumer behavior.
The latest PCE reading shows a 2.3% increase in March 2025 compared to one year ago. However, there is a slight slowdown in the rate of improvement.[11]
Consumer sentiment
Americans are feeling pessimistic about the economy, with consumer confidence dropping for four consecutive months. April's numbers show an 8% decline from March, continuing a worrying downward trend.
While people's assessment of current conditions only dipped slightly, their outlook for the future took a much harder hit. The expectations part of the index, which measures how people feel about their future financial situation and business conditions, has fallen by a remarkable 32% since January.[12]
Household debt & credit
American households are carrying more debt than ever before, with total household debt reaching $18.2 trillion in Q1 2025. This is a continued climb from Q4 2024.[13]
With interest rates remaining elevated, servicing this debt is becoming increasingly burdensome for many families. Rising debt levels combined with slowing wage growth can create a precarious situation for household finances, potentially limiting consumers' ability to spend and support economic growth.
The personal savings rate was 3.9% in March 2025, which is less than it was in previous months. This tells us that for every dollar Americans earn, they save less than 4 cents. Low savings rates leave households with minimal financial buffers against economic shocks, whether that's a job loss, an unexpected medical bill, or a broader economic downturn.[14]
Inflation trends
Inflation is the rate at which prices increase over time, measured as a percentage. The Consumer Price Index is the change in prices paid by average consumers for goods and services. It reached 320.321 in April 2025, increasing 2.33% from April 2024.[15]
Keep in mind that when we talk about inflation, we're likely talking about core inflation. Core inflation doesn't include volatile food and energy prices. This measure is considered a better indicator of underlying price pressures than headline inflation (the total CPI). In April 2025, core inflation was at a four-year low of 2.8%.[16]
Some economists have raised concerns about potential stagflation — a toxic combination of high inflation with economic stagnation — though current data suggests this remains a low-risk scenario.
Financial markets
Financial markets often serve as early warning systems for economic downturns, with investors collectively expressing their outlook through market behavior.
Stock market performance
The S&P has experienced increased volatility in 2025, currently down 5.10% from the beginning of the year to the end of April.[17] Similarly, the Dow Jones Industrial Average has retreated about 5% from its peak.[18]
During market uncertainty, some investors turn to alternative assets like investing in gold as a potential hedge, though historical performance shows mixed results.
The Volatility Index (VIX), also called the "fear index," measures expected market volatility based on S&P options prices. When investors anticipate larger price swings, the VIX rises. Recent readings around 25 are elevated, suggesting investors are hedging against increased uncertainty, though not yet at panic levels seen during previous crises.[19]
Bond yields & yield curve
Bond yields are the return investors demand for lending money to bond issuers, with longer-term bonds typically offering higher yields than shorter-term ones. This normal relationship creates an upward-sloping yield curve. When short-term yields are higher than long-term yields, the curve "inverts" — often signaling recession concerns.
The yield curve is not currently inverted, which is positive news. However, it was inverted from October 25, 2022, until December 13, 2024 — the longest continuous inversion in U.S. history. Since yield curve inversions typically precede recession, the recent return to a normal curve doesn't entirely eliminate recession concerns for late 2025 or 2026.[20]
Interest Rates & Fed Policy
The Federal Reserve ("the Fed") is America's central banking system, responsible for managing the nation's monetary policy. Its purpose is to promote maximum employment and maintain price stability. The Fed influences the economy by setting the federal funds rate, which is the interest rate banks charge each other. This rate then ripples through other interest rates across the economy.
The Federal Reserve left the federal funds rate unchanged at 4.25% to 4.5% in its most recent meeting on May 7, 2025.[21]
This decision to maintain higher interest rates means borrowing remains expensive for businesses and consumers, creating a headwind for economic growth while helping to keep inflation in check.
Labor market
The labor market often provides the clearest signals about recession risk, as employment trends directly impact consumer spending.
Unemployment rate
The unemployment rate ticked up to 4.2% in April 2025, still historically low but showing a concerning trend with three consecutive monthly increases.[22]
While this remains below the historical average, the direction matters more than the absolute level when assessing recession risk.
Job openings & layoffs
According to the March 2025 Job Openings and Labor Turnover Survey released on April 29, job openings remained relatively stable at 7.2 million. While this represents little change from February, it marks a significant decrease of 901,000 positions compared to the same time last year. The job openings rate held steady at 4.3%.[23]
Hiring activity remained unchanged at 5.4 million for the month, while total separations (people leaving their jobs for any reason) were little changed at 5.1 million. Layoffs and discharges edged down to 1.6 million, with retail trade showing the largest reduction in layoffs while state and local governments increased their workforce reductions.[23]
Housing market
The housing sector often foreshadows broader economic trends, with slowdowns typically preceding recessions by several months.
Home sales & prices
The housing market shows mixed signals heading into mid-2025. Existing home sales decreased slightly in March 2025, but inventory rose, giving buyers more options.[24]
This growing inventory could put downward pressure on home prices in the coming months if demand continues to soften. The housing market's current trajectory suggests caution among buyers, typically a leading indicator of broader economic concerns.
Mortgage rates & applications
Mortgage rates have stabilized around 6.9% for a 30-year fixed loan, down slightly from last year but still well above the historic lows of 2020-2021.[25]
Despite the spring buying season, mortgage applications decreased 4.2% in late April, reaching their slowest pace since February. Mortgage rates have stabilized around 6.9% for a 30-year fixed loan, down slightly from last year but still well above the historic lows of 2020-2021.[25]
Industry analysts point to economic uncertainty and labor market concerns as key factors dampening housing activity.
How has the government been responding?
The federal government uses two main toolkits to influence economic conditions: fiscal policy, including government spending and taxation, and monetary policy, which consists of interest rates and money supply. Currently, the Federal Reserve is maintaining higher interest rates to combat inflation, though this creates headwinds for growth. Meanwhile, recent fiscal measures have been more modest than the pandemic-era stimulus packages, with lawmakers divided on whether to prioritize deficit reduction or economic support.
These policy decisions directly affect everyday Americans through borrowing costs, job availability, and consumer prices. While the government can't prevent every economic downturn, these tools can help moderate its severity and duration.
How to prepare for a recession
Whether or not we enter a recession soon, economic uncertainty makes it wise to strengthen your financial position now. Here's how you can protect your finances:
Build or replenish your emergency fund
It's important to have 3-6 months of essential expenses in a savings account to give you a financial buffer if your income is disrupted.
Review and adjust your budget
Identify non-essential expenses that could be reduced if necessary, helping you adapt quickly to changing circumstances.
Focus on job security & skills
Stay valuable in your current role while keeping your resume updated and professional network active.
Reevaluate your investments
Take a look at your asset allocation to ensure it matches up with your risk tolerance and time horizon rather than reacting to market volatility.
Reduce high-interest debt
Pay down credit cards and other expensive debt to improve cash flow and financial flexibility.
Take advantage of market opportunities
Market downturns can present buying opportunities for long-term investors, particularly for quality assets at discounted prices. Understanding how to navigate a bear market can help you make more confident decisions while others panic-sell.
Recession FAQs
How long do recessions last?
The average recession since WWII has lasted about 10 months, though there's significant variation, from the brief 2-month COVID recession to the 18-month Great Recession
What drives economic recovery?
Recoveries typically begin when pent-up demand, lower interest rates, business investment, and sometimes government stimulus combine to restart growth.
Should I pull my money out of the stock market during a recession?
For long-term investors, staying invested through market cycles is usually the best strategy, as timing the market is extremely difficult and missing the best recovery days can significantly harm returns.
What should I do if I lose my job during a recession?
File for unemployment benefits immediately, reduce non-essential spending, tap your emergency fund if needed, and consider temporary work while searching for permanent employment.
Take control of your finances, no matter the market
Economic cycles are inevitable, but they don't have to derail your financial well-being. By understanding recession indicators and taking proactive steps to prepare, you can deal with uncertainty with greater confidence and resilience.
At Facet, we believe in helping people make the best decisions based on their unique financial situation rather than reacting to market headlines. Whether you're concerned about retirement planning during volatile times or looking to improve your overall financial wellness, a personalized approach to financial planning beats trying to predict the next recession. Ready to build a financial strategy that can weather any economic climate? Get started with Facet today.
Article References
- Joint Economic Committee Democrats, www.jec.senate.gov/archive/Documents/Reports/unempmeasure31march2003.pdf.
- The Recession of 2007–2009, www.bls.gov/spotlight/2012/recession/pdf/recession_bls_spotlight.pdf.
- “Unemployment Rate Rises to Record High 14.7 Percent in April 2020.” U.S. Bureau of Labor Statistics, U.S. Bureau of Labor Statistics, www.bls.gov/opub/ted/2020/unemployment-rate-rises-to-record-high-14-point-7-perc
ent-in-april-2020.htm. - “News Release.” Gross Domestic Product, 1st Quarter 2025 (Advance Estimate) | U.S. Bureau of Economic Analysis (BEA), www.bea.gov/news/2025/gross-domestic-product-1st-quarter-2025-advance-estimate.
- “News Release.” Gross Domestic Product, 4th Quarter and Year 2024 (Third Estimate), GDP by Industry, and Corporate Profits | U.S. Bureau of Economic Analysis (BEA), www.bea.gov/news/2025/gross-domestic-product-4th-quarter-and-year-2024-third-estimate-gdp-industry-and.
- April, www.ismworld.org/supply-management-news-and-reports/reports/ism-report-on-business/pmi/april/.
- April, www.ismworld.org/supply-management-news-and-reports/reports/ism-report-on-business/services/april/.
- "Real Gross Private Domestic Investment: Fixed Investment: Nonresidential: Structures." FRED, Federal Reserve Bank of St. Louis, fred.stlouisfed.org/series/B009RX1Q020SBEA.
- "April 2025: Small Business Optimism Declines in April." NFIB, National Federation of Independent Business, www.nfib.com/news/monthly_report/sbet/.
- "Advance Estimates of U.S. Retail and Food Services." Census.gov, U.S. Census Bureau, www.census.gov/retail/sales.html.
- "Personal Consumption Expenditures Price Index." Bureau of Economic Analysis, U.S. Department of Commerce, www.bea.gov/data/personal-consumption-expenditures-price-index.
- "Surveys of Consumers." University of Michigan, Survey Research Center, Institute for Social Research, www.sca.isr.umich.edu/.
- "Household Debt and Credit Report." Federal Reserve Bank of New York, www.newyorkfed.org/microeconomics/hhdc.
- "Personal Saving Rate." FRED, Federal Reserve Bank of St. Louis, fred.stlouisfed.org/series/PSAVERT.
- "Consumer Price Index for All Urban Consumers: All Items in U.S. City Average." FRED, Federal Reserve Bank of St. Louis, fred.stlouisfed.org/series/CPIAUCSL.
- "Consumer Price Index Summary." U.S. Bureau of Labor Statistics, U.S. Department of Labor, 10 Apr. 2025, www.bls.gov/news.release/cpi.nr0.htm.
- "S&P 500 Index." MarketWatch, www.marketwatch.com/investing/index/spx.
- "Dow Jones Industrial Average Charts." MarketWatch, www.marketwatch.com/investing/index/djia/charts.
- "Home VIX Volatility Products." Cboe, Cboe Global Markets, www.cboe.com/tradable_products/vix/.
- "U.S. Department of the Treasury." Treasury.gov, U.S. Department of the Treasury, home.treasury.gov/resource-center/data-chart-center/interest-rates/TextView?type=daily_treasury_yield_curve&field_tdr_date_value=2025.
- "Effective Federal Funds Rate." Federal Reserve Bank of New York, www.newyorkfed.org/markets/reference-rates/effr.
- "Civilian Unemployment Rate." U.S. Bureau of Labor Statistics, U.S. Department of Labor, www.bls.gov/charts/employment-situation/civilian-unemployment-rate.htm.
- "Job Openings and Labor Turnover Survey News Release." U.S. Bureau of Labor Statistics, U.S. Department of Labor, 29 Apr. 2025, www.bls.gov/news.release/jolts.htm.
- "New and Existing Home Sales, U.S." National Association of Home Builders, 29 Apr. 2025, www.nahb.org/-/media/NAHB/news-and-economics/docs/housing-economics/sales/nationwide-sales-and-inventory.pdf.
- "Mortgage Applications Decrease in Latest MBA Weekly Survey." Mortgage Bankers Association, 30 Apr. 2025, www.mba.org/news-and-research/newsroom/news/2025/04/30/mortgage-applications-decrease-in-latest-mba-weekly-survey.