 (990 x 400 px)")
Stocks fell sharply in the first quarter of 2026, with most of the losses coming after the war began in Iran. The Morningstar Global Markets index fell 2.9% for the quarter, marking the worst quarter for global stocks since 2023. The U.S. was one of the worst performing major world markets, with the S&P 500 falling 4.4%, weighed down by flagging tech stocks. Despite the dollar rebounding during the quarter, non-U.S. stocks outperformed.
Bonds ended the quarter about unchanged. The Morningstar Core U.S. bond index rose 0.1%. Traders are anticipating higher inflation in the coming months due in part to surging oil prices. This may mean the Federal Reserve is less likely to cut rates than previously assumed, which in turn put some upward pressure on interest rates during the period.
Facet’s equity results were ahead of benchmark this quarter. Our mix of ETFs has certain defenses built in, including some weaker consumer stocks, and more speculative tech. Those defenses were a big positive for performance this quarter. In addition, our underweight of China was also a significant factor. In bonds, our results were also a bit ahead of benchmark, with taxable bonds outperforming municipal bonds modestly.
A lot happened this quarter, but we’ll try to cover all of the big drivers of financial markets, how it impacted your portfolio, and what we see coming next.
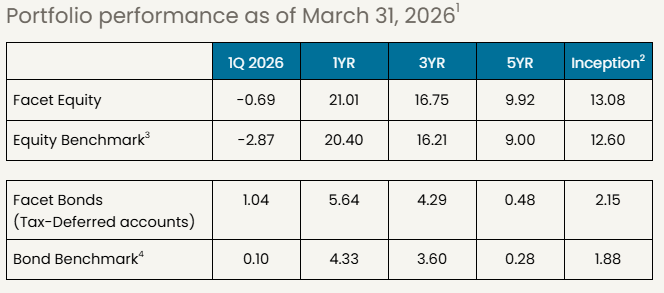
Performance Disclosure: For the portfolios listed above, Facet Equity and Facet Bonds, the results represent the equity and fixed income portions of strategy a member may be invested in but are not necessarily stand-alone portfolios. For example, for a portfolio allocated 70/30 between equity and fixed income, the Facet Equity return would represent 70% off the return on that strategy. Effective December 31, 2025, Facet transitioned to use composite performance for the Q4 2025 results and going forward. Composite performance represents the actual asset weighted investment experience for member portfolios managed to a specific strategy. Performance results since this transition are calculated using portfolio accounting software and represent actual member results. Calculations for the 12-month, 3-year, and Since Inception periods were performed using the Bloomberg Portfolio Analytics tool. Performance was calculated using Facet’s most common recommended equity and fixed-income ETF portfolios. At times when Facet changed a recommended ETF, the average transaction price of both buys and sells was used to update the portfolio. Otherwise, the portfolio was rebalanced monthly. This illustration most closely resembled what a common Facet member in a given asset allocation mix may have returned. All returns are calculated net of fees and these fees represent the fees charged for any investment in the portfolio by the underlying investment company (most ETFs). The Facet planning fee is not included in this calculation as it is for services related to planning services and investments are included without additional charge. Facet portfolios use Morningstar benchmarks which are described in detail below.
If you're a current Facet member and are interested in learning more about investing with Facet, please reach out to your planner and start the conversation. The investments team is available to meet with you, answer questions, and talk through your options.
War in Iran brings market worries
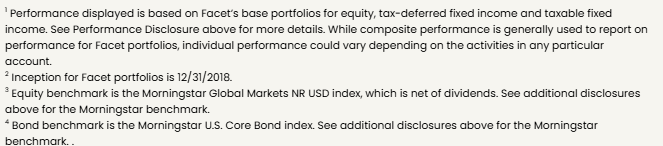
The outbreak of war in Iran caused a significant shock through the financial system. Below is a chart of the S&P 500 price and the 10-year Treasury bond yield. I drew a red line on February 27, the last trading day before U.S. and Israeli strikes began.
Source: S&P Dow Jones Indices, Bloomberg
This chart shows us what was probably already obvious: the outbreak of the war created a stark shift in financial markets. Here we just showed the broad stock market and longer-term Treasury yields, but we could have picked any number of markets. Since the war began:
- Crude oil up 56%
- Gold down 12%
- U.S. dollar up 2%
Exactly how much longer this war goes on is very much up in the air. Right as the quarter was ending, President Donald Trump suggested that he was prepared to end the war even if the Strait of Hormuz is still closed, and that the U.S. would be out of Iran in two to three weeks. This sparked a massive rally in stocks on March 31.
This is a great illustration of why market timing is so difficult, especially around geopolitical events. The longer the war went on, and the higher oil prices went, the more political pressure on Trump to end the conflict. Near the end of March, some analysts suggested $200 oil was a possibility. Clearly that would have major negative effects on the stock market. However any such forecast would have to contend with the political realities that would set in long before we got to $200 oil.
Our approach is to build portfolios that we believe can perform reasonably well across various scenarios. This helps one stay level-headed through market shocks like this one. This is an extremely fluid situation, with a lot of possibilities. You never want to make a trade that would only work in one narrow scenario, such as the $200 oil spike. Especially if such a trade would suffer serious losses should the forecast not come to fruition.
We came into this year with some ETF weightings that we felt would provide some defense against a consumer-led economic slowdown. We also had some positions that might mitigate the impact of a rise in interest rates. Not that we were forecasting either of these things per se, but we thought there were several scenarios where they could occur. So when the strikes on Iran began and oil prices spiked higher, among the risks this posed were higher interest rates and pressure on consumer budgets. We think these positions were one big reason for Facet’s outperformance this quarter.
Focusing on this portfolio-level defense, as opposed to market timing or relying on specific forecasts allowed us to make decisions we felt confident in whether the war turned out to be a longer conflict or if political pressure caused it to end early.
Interest rates have been rising
As we are writing this report, oil prices remain near their 2026 highs on concerns that the Strait of Hormuz could still be closed or partially closed even after the war is over. This has had an effect on interest rates. Over the course of March, several Federal Reserve officials indicated concerns about how oil prices could impact inflation, which in turn would make cutting rates more difficult.
We can see this by looking at futures contracts on the Fed’s target rate. Prior to the start of the war, markets were expecting two rate cuts in 2026, which some odds of a third cut. Now those cut expectations have been all but erased.
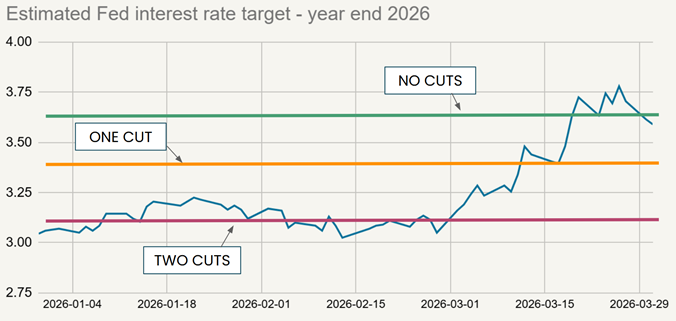
Source: CME Group
Famously, the Fed targets “core” inflation, which excludes food and energy prices. Ostensibly this means that if the only consumer price that is rising rapidly is gas, heating oil, etc., then the Fed would ignore that and focus on inflation from all other sources. However, given how severe the increase in crude oil prices are, it could create what is called a “supply shock.” In this case, this might mean that high oil and natural gas prices cause the cost of shipping or the cost of electricity to rise substantially, which could impact a wider swath of prices, not just gasoline.
Whether this winds up merely delaying rate cuts or eliminating them entirely remains to be seen. For now, this inflation concern has driven longer-term interest rates higher. The 10-year Treasury bond yield rose 0.38% during March, and mortgage rates hit the highest level in six months.
I would argue that this jump in interest rates is a significant factor in stock market performance since the war began. Oil prices are probably the single most important price for the macro economy, but their impact pales in comparison to interest rates. For now because of the severity of the rise in oil, which has nearly doubled so far this year, oil is probably the bigger effect. But interest rates are a close second in my opinion.
How will a new Fed Chair impact interest rates?
In January, President Trump nominated Kevin Warsh to succeed Jerome Powell as Fed Chair. If Warsh is confirmed, he will take over after Powell’s term as Chair ends in May.
Trump selected Warsh because the President wants interest rates lower, and Warsh has said he wants the same. However, this spike in oil prices may complicate Warsh’s plans.
First, remember that the Fed is a democratic body. The Chair only gets one vote out of 12. Historically the Chair has dominated Fed decision making, but that’s merely a precedent, not the law. With so many Fed officials publicly questioning the case for near-term rate cuts, it seems unlikely Warsh has the votes to cut rates right away.
Moreover, Warsh himself may be inclined to wait to cut rates. Warsh was a member of the Fed in 2008, when oil prices spiked all the way to $145. At the time Warsh said: “I am still concerned that inflation will be too high for too long; and even though the downside risks to growth have increased, I continue to see inflation as the predominant risk.”
Now that Warsh has the job, will he be the guy who talked up rate cuts while Trump was trying to decide who to nominate to the Fed? Or will he be the guy who was focused on inflation risk just a couple months before Lehman Brothers collapsed?
We think rate cuts are still more likely than not, but the uncertainty is high. There won’t be support on the Fed committee to cut rates if core inflation rises materially. However, if job growth were to turn negative, then all bets are off. In that scenario, we could see the Fed quickly get aggressive about cuts.
Will the real labor market please stand up?
Right now the state of the employment market is difficult to ascertain. So far in 2026, the U.S. has added an average of 68,000 jobs per month. That’s relatively low historically, but solidly higher than the 10,000 per month average job gain in 2025.
However, this benign average belies a lot of volatility. So far this year, the labor department has reported strong gains in January and March, but in between there was a sharp decline in employment in February.
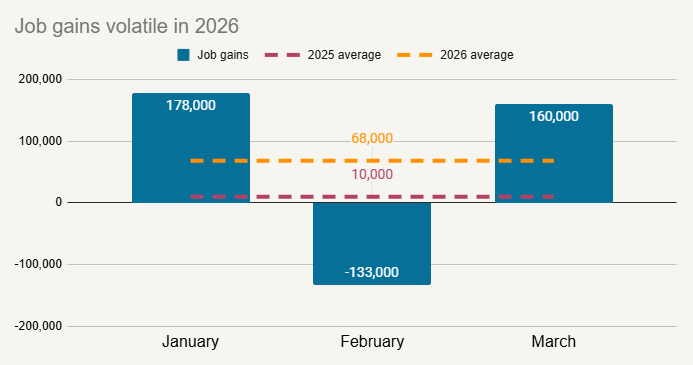
Source: Bureau of Labor Statistics
This level of volatility makes it hard to discern a trend. It may be that these extreme ups and downs reflect some statistical noise. In other words, it is very unlikely that there were large layoffs in February, but then a burst of hiring in March. It is more likely that the true state of the jobs market lies somewhere in between.
Are companies spending too much on AI?
Companies continue to announce bigger and bigger capital spending on AI projects. However, a notable thing has happened the last two quarters: the market has reacted negatively to these announcements.
Take Microsoft as an example. On January 28th, the company announced capital spending on AI was 66% higher than the prior year, about $1 billion more than Wall Street expected. Microsoft also told analysts to expect even bigger spending than previously projected in 2026. The stock dropped 10%.
Over the last two quarters, there has been increasing skepticism that all of this spending on data centers will turn into big profits for the major AI players. Microsoft wasn’t alone. Most of the stocks we’ve coined as the “AI 8” stocks as a proxy for the major AI players fell in response to earnings this quarter, and all eight posted negative returns for the whole quarter.
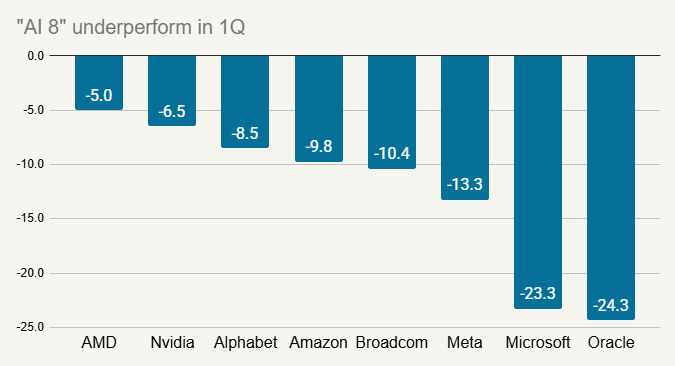
Source: Bloomberg
As we wrote in another article earlier this year, we don’t think there is an AI bubble. We also believe AI will have major long-term economic benefits. However, the phase of blind optimism about AI seems to have passed. Markets are now being more demanding: investors want to see investment in AI, but they also want to see a return on that investment. As we can see from the performance of the AI 8, patience is wearing thin.
As euphoria fades, quality companies outperform
This shift from AI euphoria to a more measured attitude has been a big boost for Facet’s performance relative to benchmark. Our mix of ETFs is tilted toward companies with higher profit margins, more stable revenues, and lower debt levels. In other words, more stable, less speculative companies. In tech specifically, there was meaningful underperformance from these more speculative companies, fueling outperformance for Facet’s tech mix. This divergence is even more stark if we rewind back to October 29, which was the recent peak for the tech sector.
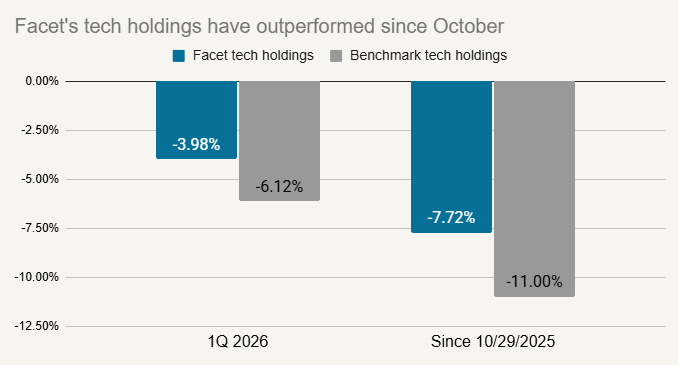
Source: Bloomberg, Morningstar
Facet’s equity strategy struggled the middle part of 2025, when excitement around AI was driving speculative stocks to eye watering highs. At the time we wrote that speculative trades can only last so long. At some point, markets start demanding real results, not just hope. Now that the AI trade has transitioned into “results” mode and not just “hope”, our strategy has made up all of 2025’s underperformance.
Could today’s winners be tomorrow’s stock market losers?
Exactly how AI will impact the economy over the long-term is highly uncertain. There continues to be debate about whether AI will destroy jobs or create a productivity boom. We probably won’t know the answer to this question for some time to come.
What we did see this quarter is how AI could create winners and losers, perhaps in some surprising ways. In January, Anthropic (parent company of Claude) announced a new plugin to help with legal contract review. This touched off a substantial drop in software and business services stocks, which has been dubbed the SaaSpocalypse (“SaaS” standing for “software as a service”). In 1Q, the software segment of the S&P 500 was down 23%.
The worry is that AI agents and/or “vibe coding” could render some business software obsolete, or at least create more competition and drive down profit margins. How real this threat might be is debatable. Our take would be that some software companies will adapt and become the providers of AI technology to enterprises. Others won’t evolve and find themselves struggling to survive. In that sense, this AI disruption fits within a long history of technological change. Companies must adapt to survive.
Another potential twist in the AI story came from Google. At the end of March they announced a breakthrough in memory compression, which could allow AI models to be trained using only 1/6th the amount of memory. This sent memory stocks lower on fears that demand for their product could soon fall.
Both of these stories emphasize that the winners of tomorrow may not be the same stocks that look like winners today. The world will adapt, there will be new technologies, and new applications of existing technology. This is a great example of why we prefer broad diversification over trying to guess tomorrow's winners. One way to know that you'll own the big winners of tomorrow is to own a little of everything.
Conversely, if you are holding on to a concentrated position in yesterday’s winners, consider this quarter a kind of warning. In 1999 companies like Intel and Worldcom and Yahoo looked like world beaters in the new internet world. Today, not so much.
Chinese economy continues to struggle
China has been dealing with the fallout of its property market bust for several years now. In the middle of 2025, there seemed to be some signs of recovery, but the most recent data has taken a turn for the worse. The graph below shows retail spending growth, but this pattern would follow for everything from property prices to good imports. There is no clear end in sight for China’s economic woes.
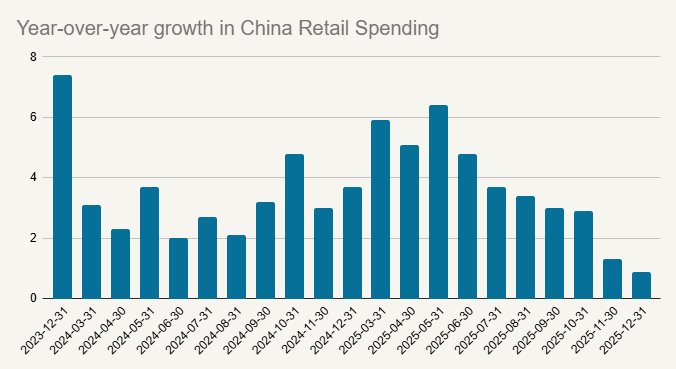
Source: National Bureau of Statistics of China
This contributed significant underperformance for China compared with most other emerging markets. In December 2025, Facet added the iShares Emerging Markets ex. China ETF (EMXC). This allowed us to add to emerging markets, but still maintain a 3% underweight to China. In the first quarter, this ex-China ETF was up 8.2% vs. -7.3% for the Morningstar China index. This China underweight was another big driver of Facet’s outperformance this quarter.
Software exposure could create risks for private investors
Private credit has been getting a lot of attention lately. For most of 2025, it was about the huge inflows those funds were getting. But now media attention has shifted its focus to two potential risks.
The first we view as less worrisome: relatively large outflows. Most private credit funds, including the credit funds Facet uses in our Alternative Income strategy, limit redemptions to 5% of total fund value. If the fund is organized as a Business Development Company (BDC), the fund can block redemptions entirely. This happened to a high-profile BDC managed by Blue Owl back in November.
Since that time basically all funds of this type have seen above-normal redemptions. Even the interval funds that Facet uses, which must honor the 5% redemptions no matter what, have seen similarly large redemption requests.
These redemption limits are very important. They protect existing investors. Private investments don’t trade often, if at all. Usually if a fund is forced to sell a private asset, it will be at a significant discount to its fundamental value. Any losses realized in the selling process are borne by all investors, not just those withdrawing. This is why these redemption limits are so important.
For funds that use large leverage or have an especially thin liquidity bucket, persistent redemptions can cause significant problems. When Facet set up our Alternative Income strategy, we intentionally avoided such funds. This gives us the confidence that even if elevated withdrawals last for multiple years, our funds shouldn’t come under any kind of special pressure. Indeed, it might allow our funds to buy cheaper assets from the funds that are forced to fire sell some assets.
The other risk in private investing is related to software. As we said above, software stocks have come under major pressure on AI disruption worries. That same pressure is manifesting itself in the private markets too. Over the last decade or so, a number of software companies have been bought by private equity in leverage buyout transactions. That has resulted in software having an outsized weight in both private equity funds. In some cases, private credit supplied some of the loans for these transactions. Overall, software loans make up about 25% of the direct lending universe.
In Facet’s Alternative Income strategy, direct lending to businesses only makes up about 30% of the total portfolio. Of this 30%, approximately 12% are software loans. This means we estimate about 4% of the total strategy is exposed to software risk.
As we said above, we don’t think the whole software business is going away. However it certainly is possible that some more marginal software companies were bought by private equity with a large amount of debt. Some of those companies may very well go bankrupt, wiping out the private equity investment and maybe causing losses for lenders. It is also possible that some more aggressive private credit funds might have loaded up on these software loans and therefore could face significant losses.
This is why Facet built our Alternative Income strategy to be as diversified as it is. We don’t just use direct lending, but also asset-based lending, real estate, and public markets credit. This enhances the liquidity of our funds, and could help provide some protection from sector-level events like the current struggles in software. Note that the Alternative Income strategy outperformed both our primary stock and bond strategies so far in 2026.
What comes next?
In the very short-term, it is likely that events in Iran will be the main driver of markets. Remember that Wall Street won’t care if this war has a good or bad geopolitical outcome. Markets are really only going to care about oil prices and interest rates. If the war plays out in such a way that oil prices stabilize, even at much higher levels, markets will likely start focusing on other factors. If somehow oil prices were to drop significantly, perhaps because some deal is cut to reopen the Strait of Hormuz, that could result in a significant short-term pop for stocks.
Just before this article was published, Iran and Oman announced they had drafted a “protocol” to “monitor traffic” through the Strait. If this were to become the long-term means by which shipping flowed through Hormuz, it might not be the political outcome the U.S. wanted. However, for financial markets, if it resulted in stable oil prices, it would do just fine.
Longer-term, we expect the health of the U.S. economy and developments in the AI market will probably be bigger drivers of markets than Iran. The combination of AI investments and consumer spending represent a much larger share of aggregate company earnings vs. anything impacted by oil prices.
Consumer spending seems to be holding up despite weak job growth. We have not seen signs of large scale layoffs just yet. Initial unemployment insurance claims have actually trended down slightly the last couple months. However, hiring remains weak, and so we think there is a thin margin for error. If layoffs were to increase even mildly, job growth could turn negative quickly.
In terms of AI, the big question is whether the major hyperscalers will keep accelerating data center spending. As we said above, the stock market has punished tech companies recently for announcing higher capital spending. Ultimately, company management is in the business of making their stock price go up, not down. At some point, something has to give. Either companies like Microsoft have to start showing a return on all this AI investment, or they are going to slow down the pace of AI spending.
We continue to think having some amount of defense in portfolios is the right way to have some protections against this risk.
- Underweight smaller companies: These are probably more vulnerable to any kind of U.S. slowdown, even if it is just focused on consumers.
- Underweight speculative tech: As tech has sold off over the last 6 months, Facet has used rebalancing to close our general tech underweight. However, we remain significantly underweight more speculative tech as well as underweight the mega cap tech giants.
- Underweight China: Not only is the Chinese economy struggling, but Chinese exports are highly vulnerable to a U.S. consumer slowdown.
- Robust non-U.S. weighting: The U.S. dollar has rebounded a bit this year, but could decline significantly should Fed rate cuts come back on the table. That is very likely if the economy were to slow again.
We think having these defensive positions could help mitigate some of the risks we have described in this article should they come to fruition. The market volatility this quarter, and Facet’s outperformance, serves as something of a proof point that this strategy might work in tough markets.
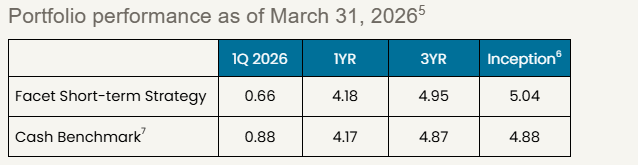
Facet’s Short-Term Strategy
Facet’s Short-Term Strategy (STS) is designed to produce stable returns commensurate with the yields available in shorter-term bonds. The strategy is designed for members with money goals that are only a year or two away.
STS’s performance was ever so slightly behind the Morningstar Cash T-Bill benchmark this quarter. In short periods, like a single quarter, the strategy tends to outperform when short-term interest rates are falling and underperform when rates are rising. The surge higher in short-term rates this quarter in response to the war wasn’t enough to cause significant underperformance, but it did cut into the strategy’s superior income generation.
However this means that looking forward, the strategy does have a higher yield, approximately 3.9% as of quarter-end. We think that over time that strong income generation should be the key driver of returns.

Facet’s Alternative Income Strategy
Facet launched the Alternative Income Strategy in May, so these results only reflect just under a year of performance. Periods of market volatility, especially with inflation being a key driver, were exactly the kinds of periods where we think Alternative Income might shine. The combination of real estate strategies as well as the floating-rate nature of the credit strategies helps mitigate periods of rising interest rates and/or high inflation.
This helped this strategy produce slightly positive returns this quarter, ahead of either most equity or bond indices. Hence, the strategy was well ahead of the 50% equity, 50% bond index we utilize.
As we wrote above, private credit is getting a lot of attention right now, but that is only one part of our strategy. We think the whole mix inside Alternative Income provides some interesting diversification for our members.


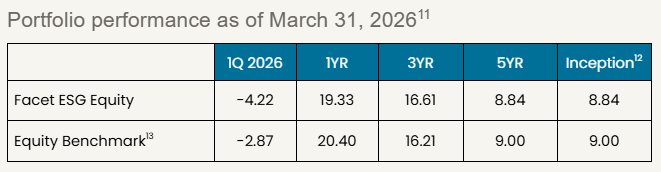
Facet’s Environmental Social Governance (ESG) Strategy
Facet’s ESG equity strategy was a bit behind benchmark this quarter. The strategy utilizes a set of ETFs that screen out stocks based on certain ESG criteria. Specifically, the screens result in almost no weighting to oil producers and refineries. With oil prices nearly doubling this year, these stocks have been by far the best performers so far in 2026. In 1Q, the energy component of the S&P 500 was up 37% whereas the whole S&P was down 4.6%.
Energy stocks are subject to these kinds of wild swings in response to commodity prices. However if we look longer-term at the strategy’s results, you can see that these swings tend to even out over time.
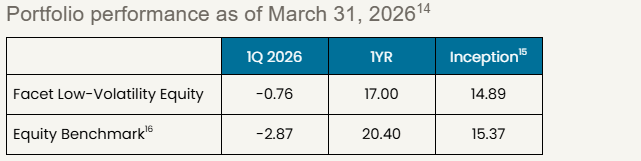
Facet’s Low-Volatility Strategy
Facet’s Low-Volatility Strategy is meant for members who are either already in retirement or close to it. The strategy utilizes ETFs that we expect will have relatively less volatility than our traditional growth strategy. Generally speaking, Facet expects this strategy to lag the equity benchmark a bit during big up quarters. However, quarters like this one, where stocks decline substantially, should be strong quarters for the strategy relatively. That was indeed the case this quarter, as the strategy outperformed by approximately 2%.
For retirees, controlling volatility is extremely important, but it must be balanced with also getting enough growth in your portfolio to keep up with inflation and your draw rate. This quarter showed how this strategy can help strike that balance between downside protection and upside capture.
Performance Disclosure: For any portfolio listed above with the label Facet Equity or Facet Bonds, the results represent the equity and fixed income portions of strategy a member may be invested in but are not necessarily stand-alone portfolios. For example, for a portfolio allocated 70/30 between equity and fixed income, the Facet Equity return would represent 70% off the return on that strategy. Effective December 31, 2025, Facet transitioned to use composite performance for the Q4 2025 results and going forward. Composite performance represents the actual asset weighted investment experience for member portfolios managed to a specific strategy. Performance results since this transition are calculated using portfolio accounting software and represent actual member results. Calculations for the 12-month, 3-year, and Since Inception periods were performed using the Bloomberg Portfolio Analytics tool. Performance was calculated using Facet’s most common recommended equity and fixed-income ETF portfolios. At times when Facet changed a recommended ETF, the average transaction price of both buys and sells was used to update the portfolio. Otherwise, the portfolio was rebalanced monthly. This illustration most closely resembled what a common Facet member in a given asset allocation mix may have returned. All returns are calculated net of fees and these fees represent the fees charged for any investment in the portfolio by the underlying investment company (most ETFs). The Facet planning fee is not included in this calculation as it is for services related to planning services and investments are included without additional charge. Facet portfolios use Morningstar benchmarks which are described in detail below.
Benchmarks: For each portfolio, Facet chooses a benchmark that best represents Performance disclosure. Past performance is not indicative of future returns .Investment returns shown here are intended for illustrative purposes only. All investments involve risk, including the potential for the loss of principal. The portfolio performance of Facet strategies began in 2018. Effective December 31, 2025, Facet transitioned to use composite performance, which represents the actual asset-weighted investment experience of a group of member portfolios managed to a specific strategy. Performance results for the current quarter period are calculated using portfolio accounting software and represent actual member results (composite performance).
Calculations for the 12-month, 3-year, and Since Inception periods were performed using the Bloomberg Portfolio Analytics tool. Performance was calculated using Facet’s most common recommended equity and fixed-income ETF portfolios. At times when Facet changed a recommended ETF, the average transaction price of both buys and sells was used to update the portfolio. Otherwise, the portfolio was rebalanced monthly. This illustration is meant to most closely resemble what a common Facet member in a given asset allocation mix may have returned.
Benchmark disclosure
The Morningstar Global Markets Index NR USD and US Core Bond indices have been licensed by Facet for use for certain purposes. The services provided by Facet are not sponsored, endorsed, sold, or promoted by Morningstar, Inc. or any of its affiliated companies (all such entities, collectively, “Morningstar Entities”). The Morningstar Entities make no representation regarding such services. All information is provided for informational purposes only. The Morningstar Entities do not guarantee the accuracy and/or the completeness of the Morningstar Indexes or any data included therein. The Morningstar Entities make no warranty, express or implied, as to the results to be obtained by the use of the Morningstar Indexes or any data included therein. The Morningstar Entities make no express or implied warranties and expressly disclaim all warranties of merchantability or fitness for a particular purpose or use with respect to the Morningstar Indexes or any data included therein. Without limiting any of the foregoing, in no event shall the Morningstar Entities or Morningstar’s third-party content providers have any liability for any special, punitive, indirect, or consequential damages (including lost profits), even if notified of the possibility of such damages.