The information provided is based on the published date.
Key takeaways
- US stocks experienced a significant downturn in the first quarter, falling over 4% due to policy uncertainty, particularly around tariffs. However, stronger performance in international markets limited the Morningstar Global Markets index's decline to about 1.5%.
- Bonds performed strongly during the quarter, with the Morningstar Core Bond index rising 2.8% as interest rates fell. This rally was driven by the same economic growth concerns that negatively impacted stocks, leading to a "flight to quality."
- The decline in US stocks wasn't solely caused by tariffs; a major factor was a sharp shift in investor sentiment from bullish to bearish, hitting expensive tech stocks hardest. In fact, the "Magnificent 7" tech stocks accounted for the S&P 500's entire loss for the quarter.
- Non-US stocks significantly outperformed US stocks, driven partly by expected European fiscal stimulus (especially defense spending) and a rotation of investor funds away from overweight US positions. While Facet's equity strategy benefited from underweighting US tech, its bond performance was mixed, with municipal bonds lagging Treasuries.
It was a tumultuous quarter for markets, with U.S. stocks falling more than 4% amidst uncertainty around tariffs and other of President Donald Trump’s policies. Away from the U.S., stocks performed much better, and this allowed the Morningstar Global Markets index to finish the quarter down about 1.5%.
Meanwhile, bonds had a strong quarter, as U.S. interest rates broadly fell. The Morningstar Core Bond index rose 2.8% for the quarter. Bonds benefited from the same concerns over economic growth that put downward pressure on stocks.
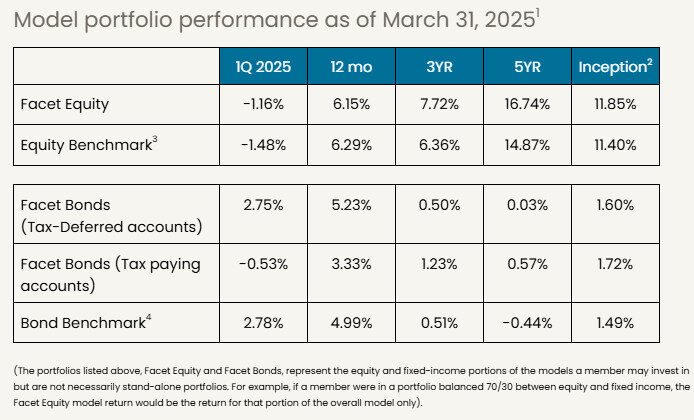
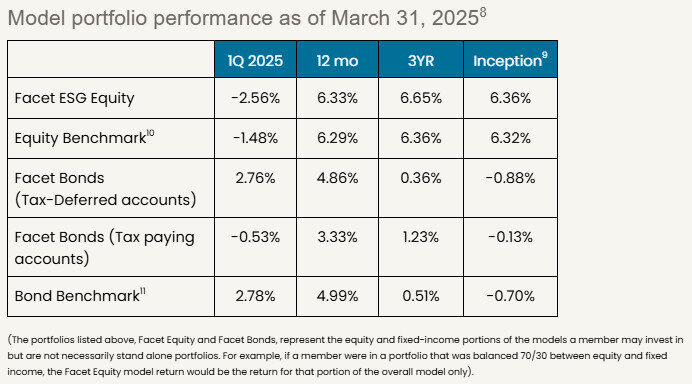
Facet’s equity exchange-trade fund (ETF) portfolios finished slightly ahead of the benchmark for the quarter. Our underweight of U.S. growth stocks, especially tech, was a big benefit to our strategy relative to the index. However this was partly offset by our underweight of emerging markets, which outperformed during 1Q. The bond ETF mix was even with the benchmark for tax-deferred accounts, but due to struggles in the municipal bond market, some taxable bond portfolios lagged.
Here are our thoughts on what happened this quarter, how it impacted our strategies, and what we expect in the coming quarters.

If you're a current Facet member and are interested in learning more about investing with Facet, please reach out to your planner and start the conversation. The investments team is available to meet with you, answer questions, and talk through your options.
Policy uncertainty leads to a stock market correction
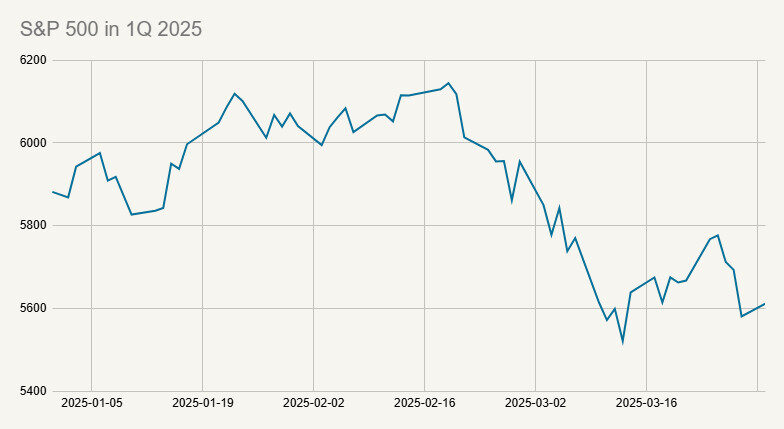
Stocks fell sharply in the last six weeks of the quarter, with U.S. markets leading the way down. After rising for the first half of the quarter, uncertainty about Trump’s policies began to weigh on markets. The S&P 500 briefly fell more than 10% from its February 19 high, which meets the technical definition of a “correction,” before rebounding a bit in late March.
Source: Dow Jones S&P Indices
As is typical of highly volatile periods, there were some wide divergences across global regions and sectors. Diving into those details reveals that the story of why markets are declining is a bit more complicated than the headlines suggest.
Tariffs don’t fully explain market move
If you were watching markets move day-by-day during the last several weeks, you would have seen that markets generally moved lower every time Trump made some announcement about tariffs. However, it would be a simplification to say that tariffs are the sole driver of the recent selloff in stocks.
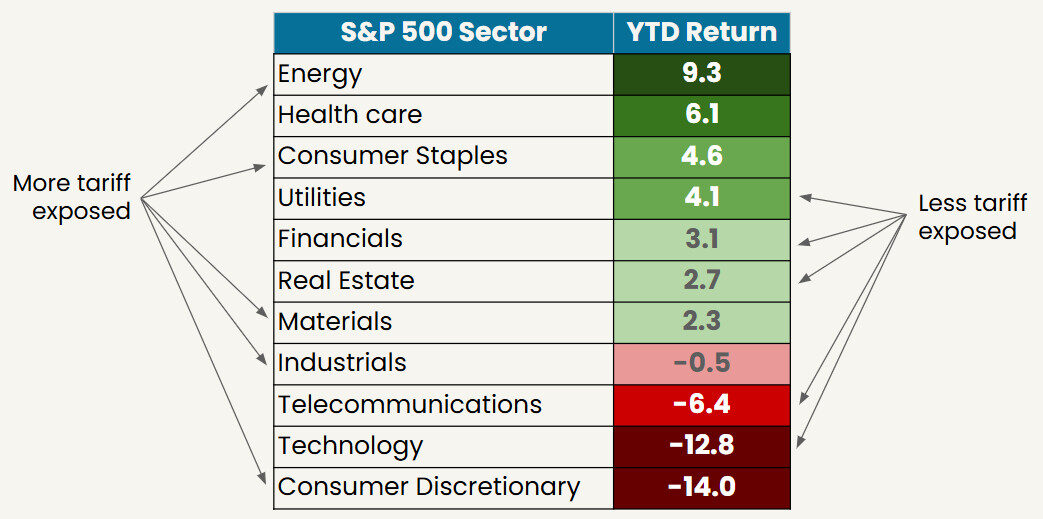
Consider this table of returns by major sectors within the S&P 500. You will notice that most sectors were positive for the quarter. But more notably, the relative performance of sectors don’t neatly fit into a narrative about tariffs.
Source: Dow Jones S&P Indices
We highlighted some sectors that are traditionally thought of as more and less exposed to trade flows. While certainly not a perfect comparison, what we don’t see is all the more traded sectors at the bottom and all the less traded sectors at the top.
We can see a similar point if we just look at the so-called “Magnificent 7” stocks. These seven very large U.S. tech companies, namely Alphabet, Amazon, Apple, Meta, Microsoft, Nvidia and Tesla. The chart below shows the contribution to the S&P 500’s return in 1Q of those seven stocks, and then the remaining 493 stocks in the index.
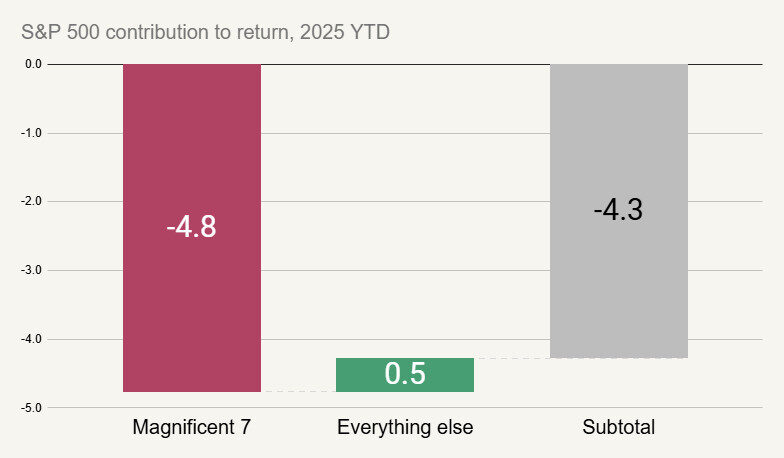
Source: Dow Jones S&P Indices
What this chart shows is that just seven stocks accounted for the entire loss for the quarter and then some. The whole rest of the index was slightly positive.
This isn’t to say that these tech companies aren’t exposed to tariffs at all. However, certainly they aren’t the most exposed to the point that they would be the overwhelming driving force behind the 1Q selloff.
Investor sentiment driving markets
We believe this tells us there’s more than just tariffs moving markets. At the end of last quarter, we discussed the fact that the market was expensive, with tech stocks especially so. An expensive market is the result of general optimism about earnings. While the earnings reports released this quarter were generally pretty good, uncertainty about Trump’s policies has been enough to reduce optimism in general.
In other words, investors don’t appear to be carefully calculating the impact of tariffs and selling the stocks most exposed. Rather they seem less excited about economic prospects generally, and are selling the stocks that were most expensive.
The chart below shows the American Association of Individual Investors sentiment survey. The red line indicates extreme bullishness (specifically, the 90th percentile of readings over the last 20 years) while the green line is extreme bearishness (10th percentile). We can see that in the span of just a few weeks, investors have swung from extremely bullish to extremely bearish.
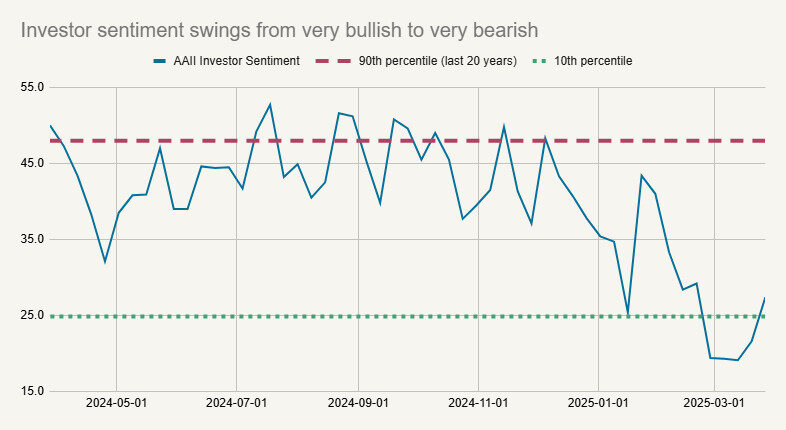
Source: American Association of Individual Investors
In January, Facet reduced exposure to tech stocks. This wasn’t a prediction that there would be this kind of sudden swing in sentiment. Rather we felt that the balance of risks and opportunities favored other sectors more than large tech. This change was a significant benefit to Facet’s investment performance in 1Q.
We should bear in mind that investor sentiment can be very fickle. Ultimately stock performance will be driven by company earnings. In other words, right now sentiment and flows seem to be dominating market movements, which is typical in short periods. But eventually it will be about how these policies actually impact company profits.
Earnings season will be key
We have argued a few times that tariffs alone probably aren’t enough to cause a recession. We feel similarly about proposed government spending cuts. However there is a risk that uncertainty about tariff policy could cause a decline in business spending. For example, maybe a company unsure of how tariffs will actually be enacted decides to delay expanding and/or hiring until there is more clarity.
If this were to happen, it can create knock-on effects. If one company decides not to buy a new piece of equipment, the equipment manufacturer loses a sale. Maybe that causes that company to slow down production. It is possible that such a sequence could cause a more serious economic slowdown.
Companies will start reporting on their financials for this past quarter starting in mid-April. These reports are always critical for stocks, but in this quarter particularly, investors will be listening for how companies are handling the uncertain policy environment. Are banks seeing less demand from companies for loans? Are suppliers seeing less buying?
As evidenced by the investor sentiment chart above, we’ve flipped from earnings expectations being quite high to investors bracing for the worst. The good news is that this means the bar is much lower for upside surprises.
Non-U.S. stocks surge
While U.S. stocks struggled in 1Q, this was not the case around the globe. Non-U.S. markets performed quite well in 1Q. In fact, the outperformance by non-U.S. developed markets over the S&P 500 was the largest for a single quarter in over 20 years.
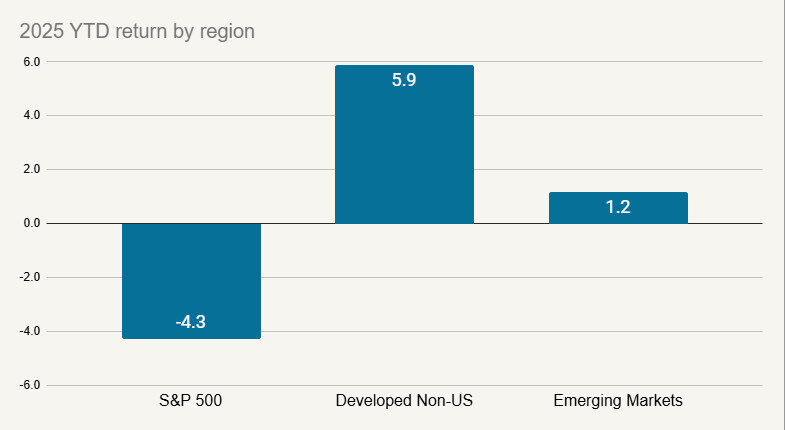
Source: Dow Jones S&P Indices, Morningstar
We think there are two separate but related drivers of this divergence. The first is some positive news out of Europe. After flirting with recession for the last two years, it appears European governments are going to enact some major fiscal stimulus. This is going to mostly come in the form of a big increase in defense spending.
While the catalyst for this is political, namely Trump’s threats to pull back from providing military support for Europe, it will have a major economic impact. Essentially, Europe is creating a sudden surge of demand for manufacturing. With that will come more hiring, and thus more consumer spending. This is a clear positive for European economies.
However, that’s not the only thing that is driving this divergence between U.S. and global stocks. There has also been major outperformance in countries like Japan or Australia, which aren’t benefiting from European defense spending. Even emerging markets, which generally rely heavily on exports for economic growth, have significantly outperformed the U.S. There isn’t any obvious fundamental reason why Trump ramping up tariff pressure should benefit emerging markets.
The answer appears to be in investor flows. At the start of the year, global investors were overweight U.S. assets (and tech in particular) by a historic degree. Now that has fully reversed and investment managers are underweight U.S. That kind of rapid shift probably dragged markets like Japan and emerging markets higher, as many investors probably reallocated to global stocks generally, not just Europe.
Facet’s strategy has maintained a market weight to developed markets, so we were not caught up in this scramble to invest overseas. However, we are still underweight emerging markets. Given the strong relative performance of emerging this quarter, this underweight was a detriment to relative return.
Our view is that emerging markets remain risky in this environment. As we said above, these economies tend to rely heavily on exporting goods to developed countries. Guessing investor flows is very tricky. An asset or region can get heavily inflows one month, but it dries up the next. We would prefer to focus on the economic fundamentals, and on that basis, we still think risks in emerging markets merits an underweight.
Bond yields fall modestly, municipal bonds struggle
Bonds had a strong quarter, as falling yields boosted bond prices, especially for Treasury bonds. The 10-year U.S. Treasury yield dropped from 4.57% to 4.21% this quarter. Bond prices rise when the yield falls and vice versa.
Historically, Treasury bond yields tend to fall when economic uncertainty rises. This is a major reason why bond portfolios tend to be good diversifiers to stocks. While this was not the case in 2022, bond prices have risen in each of the prior five negative years for the S&P 500.
There are two reasons why bonds usually rise when stocks fall, and both are probably part of what drove bond prices higher in 1Q. First, when stocks decline, investors tend to gravitate toward safer assets. Treasury bonds are one of the safest assets in the globe. This is called a “flight to quality” trade.
Second, when the economy weakens, the Federal Reserve often cuts interest rates. This tends to put downward pressure on Treasury yields as well. Indeed this quarter investors began anticipating that the Fed could cut rates more in 2025 than was previously assumed.
However not all bonds benefited from this flight to quality by the same degree. Tax-exempt municipal bonds struggled this quarter. While the broad taxable bond market was up about 2%, the tax-free municipal market was down marginally. This resulted in a large performance dispersion between Facet accounts that use taxable vs. tax-free bonds.
It is not unusual for municipals to lag Treasury bonds in periods where interest rates drop. Usually municipals catch up in subsequent quarters. This quarter there were some items that impacted state and local governments directly, including White House threats to cut funding for certain programs. To us this emphasizes the importance of owning a highly diversified and high quality muni portfolio.
In addition, the deduction for state and local taxes (also called SALT) may be increasing. If so, this will lower the tax bill of many Americans, but also slightly reduces the benefit of owning municipal bonds. This might also be contributing to muni underperformance.
All that being said, it means municipal bonds are currently quite attractive, at least relative to Treasury bonds. We would expect the performance gap between municipals and taxable bonds to narrow in the coming quarters.
The Fed could become a key player in 2025
As mentioned previously, markets have begun to expect more Fed rate cuts in 2025. This might seem a bit counterintuitive, as tariffs tend to cause prices to go up, and typically when inflation is high the Fed hikes rates.
This could still be the outcome if the economy remains strong. But if the economy weakens, perhaps because of the business spending problem we outlined above, inflation may fade as an issue. In other words, it could be that the tariff effect is just a one-off price increase, and this ultimately gets overwhelmed by other economic forces.
If this turns out to be the case, the Fed has a lot of room to cut rates. There is a chance this could help revive the housing market. Right now home buying activity is severely depressed. This is mainly because high interest rates have made homes hard to afford for those buying. At the same time, it is uneconomic for existing homeowners to sell if they have an older, lower-rate mortgage.
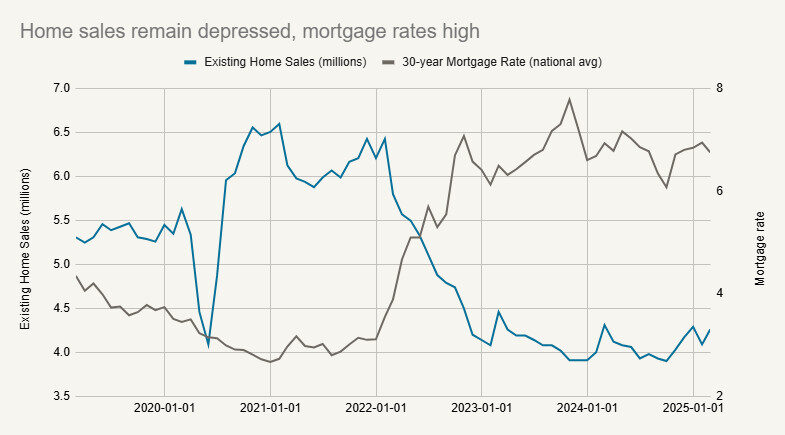
Source: National Association of Realtors, Freddie Mac
A revived housing market could be a major source of economic activity, and in turn help fuel an economic rebound. Over the last 18 months or so, we’ve been talking less about the Fed as a major driver of markets, but this could change. If the economy does slow from here, the Fed could wind up coming to the rescue.
There are upside and downside scenarios
Market corrections, that is periods where stocks drop at least 10%, are actually quite common. Over the last 50 calendar years, there have been 27 years with a correction. When stocks drop by this degree, there’s always a reason. Right now it is about policy uncertainty, but in other years it was some other issue driving markets lower.
Worth noting that in only nine of those years did stocks finish the year negative. The other 18 years stocks rebounded enough to finish the year positive.
We can’t know whether 2025 will be one of those years where stocks keep dropping or whether there will be a rebound. Usually when you are in the throes of a correction, it will feel inevitable that the market will keep dropping. And yet, about ⅔ of the time, that isn’t the case.
This is why Facet’s investment process focuses on a range of possible market outcomes. Right now we need to be prepared for potential economic weakening related to tariffs and the uncertainty it is bringing. However we also need to prepare for other possibilities.
For example, a big part of the tariff uncertainty is the fact that Trump keeps changing the parameters. Companies could adjust better to the tariffs if they knew exactly what they were. While it seems unlikely that Trump will back off tariffs completely, it isn’t hard to imagine the tariff rules becoming more clear to companies. That could revive business spending and put the economy back on solid footing.
This is just one upside possibility. We mentioned above the benefits the Fed could bring via rate cuts. There also could be stimulative effects from tax cuts later this year. As we are making investment decisions, we are going to consider all of these possibilities, both upside and downside.
We should also mention that times of volatility are when investors tend to make big mistakes. We have often said that staying objective and keeping your emotions in check are critical elements to successful investing. These are times when that gets hard.
Remember that your Facet team, including myself, are here for all members. If you have investment or market-related questions, please send them to your planner. We may not always have the answers, but we can always help walk you through our thinking on market events.
Facet’s Short-Term Strategy
Facet’s Short-Term Strategy (STS) is designed to produce stable returns commensurate with the yields available in shorter-term bonds. The strategy is designed for members with money goals that are only a year or two away.
STS’s performance was a bit ahead of the Morningstar Cash T-Bill benchmark during 1Q. The strategy holds a mix of floating rate bonds and 1-3 year Treasury bonds. With the Fed holding rates steady this quarter, the floating rate bonds kept up with T-Bills, while the 1-3 year bonds benefited from modestly lower 2-3 year bond yields.
This is what we expect to typically happen with this strategy. Over short periods, like a month or a quarter, there will usually be mild underperformance when rates rise, mild outperformance when rates are steady or falling.
However, over longer periods, it is going to be income generation that drives this portfolio’s performance. With a 4.4% yield, we believe STS offers a solid yield while also keeping volatility low.


Facet’s Environmental Social Governance (ESG) Strategy
After a strong 2024, Facet’s ESG equity strategy underperformed the Morningstar Global index for the first quarter of 2025. The strategy utilizes a set of ETFs that screen out stocks based on certain ESG criteria. Specifically, the screens result in a significant underweight energy, utilities, and heavy industrial companies.
Energy has been comfortably the strongest performing sector so far this year, and so being underweight has been a drag on results. Utilities and industrials have also outperformed, although by a lesser degree than energy. Over longer periods, we think these periods of under and outperformance are likely to even out and leave this strategy close to benchmark, but when there are large performance deviations in sectors like energy, it will impact the ESG strategy.
On the bond side, performance was very similar to the benchmark. In bonds, the performance variation among sectors was much smaller than equities, as is typically the case.

Facet’s Retirement Strategy
Facet’s Retirement Strategy is meant for members who are either already in retirement or close to it. The strategy utilizes ETFs that we expect will have relatively less volatility than our traditional growth model. Generally speaking, Facet expects this strategy to lag the equity benchmark a bit during big up quarters. Adding lower-volatility funds to this ETF mix should protect against the downside while giving up some upside.
This quarter the strategy outperformed the Morningstar Global index. This was driven by the position in the lower volatility U.S. ETFs, which outperformed general U.S. large cap stocks by nearly 10% this quarter alone. We also got some benefit from the international lower volatility ETF, which has a slightly higher weighting to European defense companies than the general market. As Europe has ramped up defense spending, these stocks soared.


Performance disclosure
Investment returns shown here are intended for illustrative purposes only. All investments involve risk, including the potential for the loss of principal. The model portfolio performance of Facet models began in 2018. Performance was calculated using Facet’s most common recommended equity and fixed-income ETF portfolios. At times when Facet changed a recommended ETF, the average transaction price of both buys and sells was used to update the portfolio. Otherwise, the portfolio was rebalanced monthly. Calculations were performed using the Bloomberg Portfolio Analytics tool. This illustration is meant to most closely resemble what a common Facet client in a given asset allocation mix may have returned. It does not represent any actual client or group of clients. The benchmark used for equity allocations is the Morningstar Global Markets Net Dividends index, which measures the performance of the stocks located in developed and emerging countries across the world. For fixed income allocation, the benchmark is the Morningstar US Core Bond index, which measures the performance of fixed-rate, investment-grade USD-denominated securities with maturities greater than one year. We believe the sources for this data to be reliable but cannot guarantee the accuracy or completeness of the information. No consideration was given to tax loss harvesting or other activities that occur during the ongoing management of investments, nor did Facet assert an opinion on the impact of these actions on these returns. These returns were calculated net of the fees associated with the underlying investments. Facet charges an annual planning fee based on the complexity of a client’s financial situation but does not charge a separate fee for investment management. The planning fee was not considered in the calculation of returns. Past performance is not indicative of future returns.
Benchmark disclosure
The Morningstar Global Markets Index NR USD and US Core Bond indices have been licensed by Facet for use for certain purposes. The services provided by Facet are not sponsored, endorsed, sold, or promoted by Morningstar, Inc. or any of its affiliated companies (all such entities, collectively, “Morningstar Entities”). The Morningstar Entities make no representation regarding such services. All information is provided for informational purposes only. The Morningstar Entities do not guarantee the accuracy and/or the completeness of the Morningstar Indexes or any data included therein. The Morningstar Entities make no warranty, express or implied, as to the results to be obtained by the use of the Morningstar Indexes or any data included therein. The Morningstar Entities make no express or implied warranties and expressly disclaim all warranties of merchantability or fitness for a particular purpose or use with respect to the Morningstar Indexes or any data included therein. Without limiting any of the foregoing, in no event shall the Morningstar Entities or Morningstar’s third-party content providers have any liability for any special, punitive, indirect, or consequential damages (including lost profits), even if notified of the possibility of such damages.


