

Global stocks had a strong quarter, with the Morningstar Global Markets index rising nearly 7%, hitting a new all-time high in September. Unlike last quarter, the gains were broadly based. Large companies, small companies, domestic, foreign, etc., all posted strong results this quarter.
Bonds also had a strong quarter, as investors began to anticipate a series of rate cuts from the Federal Reserve. The Morningstar Core Bond index rose more than 5%, erasing what had been a YTD loss.
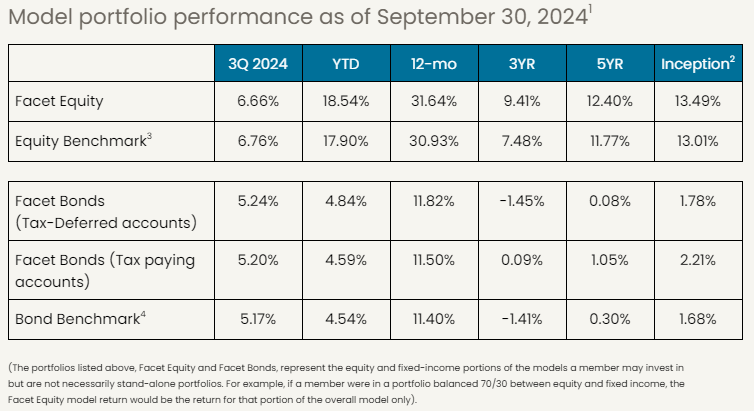
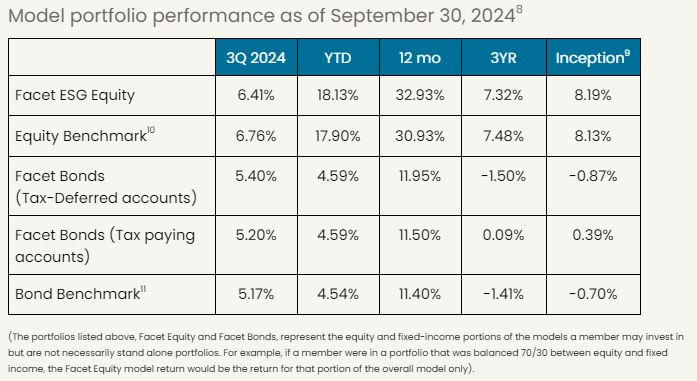
Facet’s primary equity and bond ETF mixes performed similarly to the benchmark, but remains solidly ahead for 2024 as well as longer time frames.
Here is our analysis of what happened and what it might mean looking forward.
If you're a current Facet member and are interested in learning more about investing with Facet, please reach out to your planner and start the conversation. The investments team is available to meet with you, answer questions, and talk through your options.
Tech stocks struggle, small caps shine
In the first half of the year, AI-related stocks were truly the dominant source of performance. Of the 7,955 holdings in the Morningstar Global index, just 10 AI-related companies accounted for half of the performance during the first two quarters of the year.
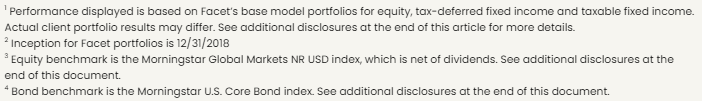
That changed dramatically in 3Q. During the most recent earnings season, tech stocks mostly continued to report strong demand for AI-related products and services. However they also reported they would be spending heavily to expand AI capabilities. This big investment spending was met with a lot of skepticism on Wall Street. Right now investors are demanding certainty as to the return on these investments, and with AI such a nascent market, there’s no such certainty.
This led to some of the AI darlings of the first half really struggling during 3Q.
Source: Bloomberg
Meanwhile, most other stocks did well during the quarter. According to Russell, 71% of U.S. listed stocks were higher this quarter, with smaller company stocks leading the way. The small company Russell 2000 index outperformed the large company S&P 500 9.3% vs. 5.9% during this period.
Was AI a bubble after all?
During the big run-up in AI-related stocks earlier this year, many were making comparisons to the internet bubble of the 1990’s. We argued at the time that the AI boom didn’t fit the “bubble” moniker. With the air coming out of AI stocks this quarter, does this change our view?
Not really. If anything it reinforces our view that the market is acting rationally. During a mania period, investors set aside their skepticism and chase speculative returns. I.e., markets will buy any reasoning to justify rosy outcomes.
That’s the opposite of what’s happening today. Markets are treating claims about AI with skepticism. During the 1990’s boom, when a company said it was investing in the internet, money would pour in to support that investment. Today, when big companies say they are investing in AI, Wall Street demands to know when that investment will pay off. If CEOs can’t be specific, the stock drops.
We think this healthy skepticism leaves room for upside in markets. If AI investments do pay off, there’s plenty of room for tech stocks to rise from here.
Some worries from the jobs market
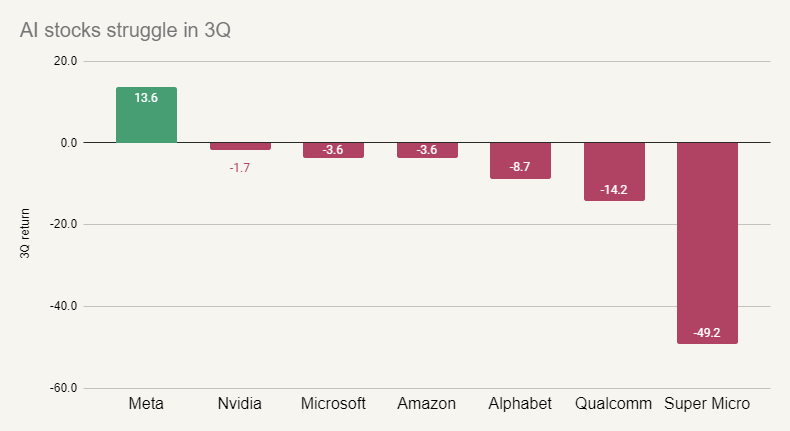
There have been some concerning signs from the labor market in recent months. While the rate of layoffs remains very low, the rate of hiring has declined. This has caused the unemployment rate to creep up. Currently unemployment sits at 4.2%, having risen from as low as 3.4% in mid-2023. Historically, there has never been an unemployment increase of 0.8% outside of a recession.
Source: Bureau of Labor Statistics
Now like a lot of things about the post-COVID economy, this period may be an exception to the normal trends. Specifically, normally unemployment rises because companies start doing large scale layoffs. That’s not happening today. In fact, the rate of layoffs today is as low as anytime from 2000 to 2019.
Instead, the increase in unemployment is coming from new workers entering the labor force and not finding jobs right away. This is coming partly from immigration, but also from other sources. Usually a growing labor force is seen as a positive economic sign, not a negative one.
Overall, we think there are a lot more positive signs for the economy than negative ones. However there are risks. This is why we have built in some recession protection in portfolios, including underweight more economically sensitive stocks, underweight companies with heavy debt burdens, and overweight companies with higher profit margins. We think this mix affords portfolios some protection should the economy weaken, without being so defensive as to harm returns in a stable economy. This is a good example of Facet’s balanced approach.
Fed starts rate cutting cycle
This softness in labor has the Fed’s attention. The Fed cut interest rates by 0.5% in September while telegraphing that more rate cuts are coming.
The Fed’s actions in the coming months will have a number of impacts on financial markets. By far the most important will be whether the economy avoids slowing further. Fed Chair Jerome Powell said this larger rate cut was a “risk management” decision. Meaning, the Fed was worried enough about the aforementioned weakness in labor that they wanted to move a bit more quickly to ease policy conditions.
There have been several times in the past where the Fed cut rates in response to early signs of a softer economy, and those cuts were enough for growth to resume. This is what is meant by a “soft landing” and achieving this is key for how markets will perform in the coming quarters.
Longer-term interest rates fall, but will that continue?
Anticipation of an extended Fed rate cutting cycle has caused a broad decline in interest rates. The 10-year Treasury yield fell from 4.40% to 3.78% during this quarter, with similar declines for most other maturities.
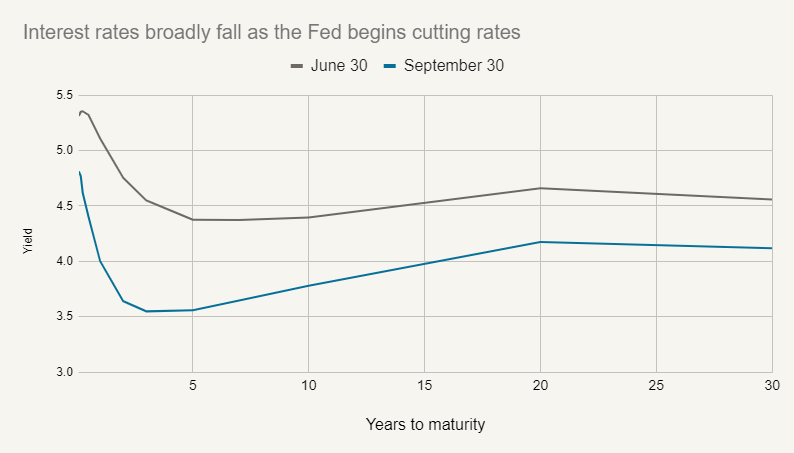
Source: Bloomberg
The good news is that this helped fuel a big quarter for bond returns. The Morningstar Core Bond index was up 5.2% this quarter, and is now up 11.4% over the last year.
The bad news is that we’re skeptical this bond rally continues. The yield on the 10-year Treasury today reflects a large number of anticipated Fed rate cuts. Our estimate would be that the 10-year yield at 3.78% anticipates the Fed cuts all the way to a bit below 3.0% (from 5.0% today) between now and the end of 2025.
That could certainly happen, but this means that for longer-term bond yields to keep falling, the Fed has to cut more than that. Conversely, if the economy shows renewed strength in the coming months, the Fed could easily stop cutting at 3.5% or 4.0%. If that happens, longer-term bond yields probably rise. Note that if long-term bond yields rise, home mortgage rates probably rise too.
Fed rate cuts weaken the dollar, bolster non-U.S. stock returns
In another major Fed-related impact, the U.S. dollar weakened against most major currencies this quarter. One of the classic reasons for a currency to weaken is declining interest rates, particularly relative to other currencies. In this case, the U.S. Fed is seen as cutting rates substantially more than other central banks, which is putting downward pressure on the dollar.
This boosted returns for non-U.S. stocks, especially in developed markets.
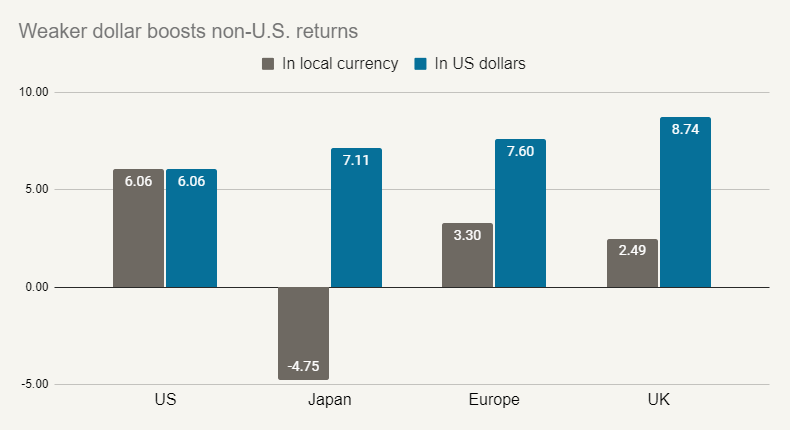
Source: Morningstar
Remember that most of the biggest companies in non-U.S. markets operate globally. A company like Nestle isn’t especially tied to the economy of Switzerland. Same goes for Louis Vuitton and France or Anheuser-Busch and Belgium or Sony and Japan. However any investment in these companies is highly impacted by the currency value. We can see this very much on display in the chart above, where the U.S. outperformed all those markets in local currency terms, but when returns were translated back into dollars, the foreign markets were actually outperformers.
It is possible this trend continues. While the Fed is set to cut rates substantially in the coming months, the European Central Bank and Bank of England are likely to cut much slower. The Bank of Japan is actually likely to hike rates slightly.
In our view, global stocks are an especially good diversifier right now. Right now the Fed’s target rate is higher than almost all other major developed market central banks. That means that if the U.S. hits a recession, we have further room to cut than most other countries in an economic slowdown. What that could mean is that if a recession does hit and the Fed has to get aggressive with rate cuts, the dollar could drop materially.
Hence we could be entering a period where global stocks outperform the U.S., especially if the U.S. slips into a more pronounced slowdown.
Emerging markets rebound on China stimulus
Chinese stocks have really struggled over the last few years, with the Morningstar China index posting negative returns in 2021, 2022 and 2023. However in late September, the Chinese government announced a series of stimulus packages. This includes a reported ¥2 trillion sovereign bond aimed at reducing local government debt burdens and direct consumer stimulus, something the Chinese central government has resisted doing until now. China is also reportedly considering direct injections of capital into banks, something they have not done since the 2008 financial crisis.
On one hand, these extreme measures show just how dire the economic situation is in China. In addition, the consumer stimulus only amounts to 1.5% of GDP. By contrast, the U.S. COVID-era consumer stimulus was almost 4% of GDP. It is distinctly possible that these measures by China are simply not enough to address pretty severe imbalances in their economy.
However, on the other hand, most economists have been arguing for multiple years that China needed to focus on consumer stimulus. It is certainly a good sign that they are finally listening.
Regardless, these announcements sent Chinese stocks soaring. The Morningstar China index jumped more than 22% during the last six days of September, erasing what had been a YTD loss.
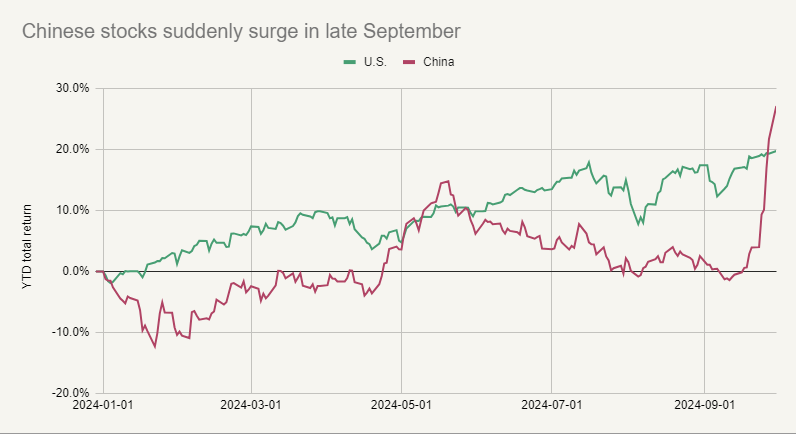
Source: Morningstar
Facet is only half-weighted to emerging markets (EM) overall, and therefore about 3% underweight China. That doesn’t seem like a big underweight, but when there is such an extreme move as this 22% lurch higher, it has an impact on relative performance. For the quarter, the China underweight was approximately a 0.55% drag on Facet’s results compared to benchmark.
However we are maintaining the emerging markets underweight. Our reasoning for being underweight was not China-specific. Rather it was the fact that EM tends to severely underperform when the U.S. and other developed countries slow down. Hence we view this EM underweight has one of our defensive positions just in case there is a U.S. or even global recession.
Facet’s equity strategy marginally behind benchmark, bonds mixed
Facet’s equity mix was ever so slightly behind the benchmark this quarter. Our U.S. holdings outperformed those in the Morningstar benchmark. This was driven by our general overweight of high profitability companies, and in particular, being underweight more speculative growth companies. Through the volatility around tech earnings, the companies that held up best were those with diverse revenue streams and high profit margins. The ones that really suffered were unprofitable companies or those with less certain long-term growth potential. This dynamic benefited our relative performance.
The one drag on Facet’s results in equities was emerging markets, as mentioned above. The surge in Chinese stocks resulted in EM outperforming the U.S. by 3%. This was enough to offset our outperformance in domestic stocks.
Bonds were mixed. For members holding taxable bonds, performance was in-line with the Morningstar Core Bond benchmark. We are a bit underweight interest rate risk, which was something of a drag given how rapidly rates fell this quarter. However we were also overweight corporate bonds, which had a very strong quarter. We were also overweight bonds maturing between 3-7 years, which outperformed other parts of the curve.
However, municipal bonds trailed taxable bonds significantly this quarter. As a result, members in higher tax brackets saw a bit of underperformance. This is not unusual during periods where Treasury interest rates decline rapidly. The opposite happened in 2022-2023 when interest rates were rising rapidly: munis outperformed substantially. These short-term fluctuations tend to even out over time, and therefore we prefer to focus on after-tax income generation rather than try to time interest rates.
What might be coming next?
On balance there’s a lot going for stocks right now. The Fed cutting aggressively after just a couple of months of weaker job reports is a good sign. I think this greatly increases the chances that employment growth rebounds or at least stays steady. One interesting stat: the day before the Fed cut interest rates at the end of October, the S&P 500 was only 0.3% below an all-time high. Since 1990, there have been eight other times the Fed has cut with the S&P less than 1% from highs. In the 12-months after those cuts, the S&P average return was 24% with zero negative periods.
Of course, there’s no guarantee that history repeats itself now. But it does illustrate that when the Fed manages to ease rates before there is major economic trouble, it tends to be a powerful tailwind for stocks.
While we think continued growth is the most likely scenario, I do have concerns about the softness in the labor market. Historically job growth tends to be either strong or negative. There hasn’t been any period from 1980 to today where job growth has sustained between 0-1%. It is basically always above 1% or it turns negative. Job growth has been 1.2% over the last 6-months, so that’s perfectly sustainable. But it has been only 0.9% the last 2 months. I will get somewhat more concerned if there isn’t a bit of a rebound over the next several months.
As mentioned above, we’ve got some defensive positions built into our portfolios, including being underweight emerging markets, overweight companies with high profit margins, and underweight those with high debt burdens. We think this creates a balance where our portfolios can keep up if the economy continues growing, but have some degree of resiliency should the economy slow. The fact that Facet’s equity ETF mix has outperformed so far this year is hopefully supporting evidence that our balanced approach can be effective.
Another huge variable will be tech earnings. The big players in AI are going to need to show some progress on turning all of their spending into actual profits. As I said previously, Wall Street just isn’t going to take it on faith that AI really is the next big thing. Traders are going to want to see some proof of a strong return on investment.
The good news is that expectations for these companies aren’t as sky high as they were 3-4 months ago. The bad news is that AI remains such a nascent technology and developing these big AI models is so expensive, it may be difficult for companies to really prove the profits will be there right away. That being said, we see substantial upside for the market if tech companies can manage the narrative around their capital investments and profitability.
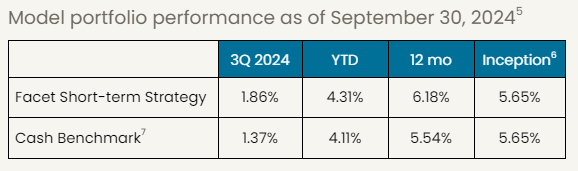
Facet’s Short-Term Strategy
Facet’s Short-Term Strategy (STS) is designed to produce stable returns commensurate with the yields available in shorter-term bonds. The strategy is designed for members with money goals that are only a few years away.
The STS’s performance was a bit ahead of the Morningstar Cash T-Bill index this quarter, allowing the strategy to pull ahead of the benchmark for the year. The general decline in interest rates this quarter led to some price appreciation in the 1-3 year Treasury bonds within the strategy. This follows the pattern we would generally expect from this strategy: mild underperformance when rates rise, mild outperformance when rates are steady or falling. For more on how STS (and other short-term investment options) are impacted by Fed rate cuts, see our Learn article here.
Facet’s Environmental Social Governance (ESG) Strategy
Facet’s ESG equity strategy was marginally behind the Morningstar Global index for the quarter. The strategy utilizes a set of ETFs that screen out stocks based on certain ESG criteria. As a result, it tends to significantly underweight energy, utilities, and heavy industrial companies.
The weighting in these sectors tends to dominate short-term performance, as this quarter was no exception. Utilities were big winners this quarter, as markets anticipated greater power use from AI-related projects. This was a bit of a drag on the portfolio. This was somewhat offset by the strategy’s underweight in energy companies in the business of mining or drilling for fossil fuels. With oil prices dropping this quarter, these companies underperformed. Despite that, the strategy remains ahead for YTD and longer time frames.
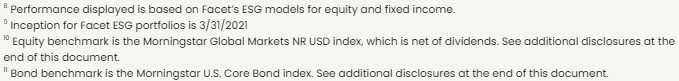
Facet’s Retirement Strategy
Facet’s Retirement Strategy is meant for members who are either already in retirement or close to it. The strategy utilizes ETFs that we expect will have relatively less volatility than our traditional growth model. Generally speaking, Facet expects this strategy to lag the equity benchmark a bit during big up quarters. Adding lower-volatility funds to this ETF mix should protect against the downside while giving up some upside.
However, this quarter was an exception, as the strategy outperformed marginally despite the big up move in stocks. In July and early August, there was some severe market volatility related to the Japanese yen and some struggles in tech earnings. During this period, the lower volatility funds we own within this strategy outperformed substantially. The market subsequently rebounded, but these funds were able to hang on to that outperformance for the remainder of the quarter.
While we don’t think it will be common for the strategy to keep up in large rallies like this one, we are pleased that the strategy did ameliorate volatility this quarter. That is good evidence that the strategy is working as designed.
Performance disclosure
Investment returns shown here are intended for illustrative purposes only. All investments involve risk, including the potential for the loss of principal. The model portfolio performance of Facet models began in 2018. Performance was calculated using Facet’s most common recommended equity and fixed-income ETF portfolios. At times when Facet changed a recommended ETF, the average transaction price of both buys and sells was used to update the portfolio. Otherwise, the portfolio was rebalanced monthly. Calculations were performed using the Bloomberg Portfolio Analytics tool. This illustration is meant to most closely resemble what a common Facet client in a given asset allocation mix may have returned. It does not represent any actual client or group of clients. The benchmark used for equity allocations is the Morningstar Global Markets Net Dividends index, which measures the performance of the stocks located in developed and emerging countries across the world. For fixed income allocation, the benchmark is the Morningstar US Core Bond index, which measures the performance of fixed-rate, investment-grade USD-denominated securities with maturities greater than one year. We believe the sources for this data to be reliable but cannot guarantee the accuracy or completeness of the information. No consideration was given to tax loss harvesting or other activities that occur during the ongoing management of investments, nor did Facet assert an opinion on the impact of these actions on these returns. These returns were calculated net of the fees associated with the underlying investments. Facet charges an annual planning fee based on the complexity of a client’s financial situation but does not charge a separate fee for investment management. The planning fee was not considered in the calculation of returns. Past performance is not indicative of future returns.
Benchmark disclosure
The Morningstar Global Markets Index NR USD and US Core Bond indices have been licensed by Facet for use for certain purposes. The services provided by Facet are not sponsored, endorsed, sold, or promoted by Morningstar, Inc. or any of its affiliated companies (all such entities, collectively, “Morningstar Entities”). The Morningstar Entities make no representation regarding such services. All information is provided for informational purposes only. The Morningstar Entities do not guarantee the accuracy and/or the completeness of the Morningstar Indexes or any data included therein. The Morningstar Entities make no warranty, express or implied, as to the results to be obtained by the use of the Morningstar Indexes or any data included therein. The Morningstar Entities make no express or implied warranties and expressly disclaim all warranties of merchantability or fitness for a particular purpose or use with respect to the Morningstar Indexes or any data included therein. Without limiting any of the foregoing, in no event shall the Morningstar Entities or Morningstar’s third-party content providers have any liability for any special, punitive, indirect, or consequential damages (including lost profits), even if notified of the possibility of such damages.