,On,A,Wooden,Wet,Table")
At Facet, we often find that investors with a long time horizon, such as a younger person saving for retirement, are tempted to delay putting their money into the market.
Because their goal is a long way off, sometimes there is a lack of urgency about getting started. Unfortunately, delaying investing is one of the most common mistakes people make.
The longer you can have your money in the market, the better off you are likely to be. Given that, the best time to start is right now.
Time in the market
The core reason why time in the market is so essential is compound interest. This is the idea that money doesn’t grow in a straight line. Instead, if you reinvest your earnings back into the market, your money will grow ever more rapidly.
Given this phenomenon, each extra year your money continues to grow makes a big difference.
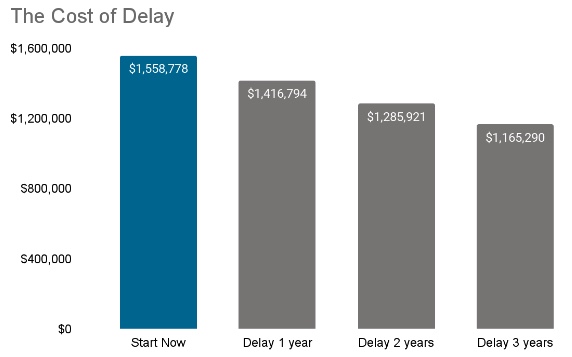
In the chart below, we show a typical long-term savings situation.
Here, an investor starts with $100,000 and saves an extra $20,000 per year in their portfolio. We assume an 8.49% return per year, which is what the Morningstar Global Markets index has returned over the last 20 years.
We can see from the bar in blue that this investor would wind up with just over $1.5 million at the end of a 20-year horizon.
Source: Morningstar
The chart also illustrates the cost of delay. For example, say this investor delayed starting this process by just one year. That mistake winds up costing them over $140,000. If they wait two years, the cost jumps to just under $275,000. Three years? Almost $400,000.
Note that the longer your horizon, the more the cost of delay grows. If we ran this same exercise but for a 30-year horizon, the difference between investing now and delaying a year would be over $320,000.
Opportunity cost matters
Often, people only think of investment decisions as “costing” them if they lose money. But the illustration above shows this isn’t true. You could lose money but also miss out on the opportunity to make money. That is why this mistake is sometimes called “opportunity cost.”
The chart shows that not participating in the market’s upside can have the same costs as suffering market downside.
Note that a similar concept applies to other decisions. One example is having an allocation too conservative for your time horizon and goals.
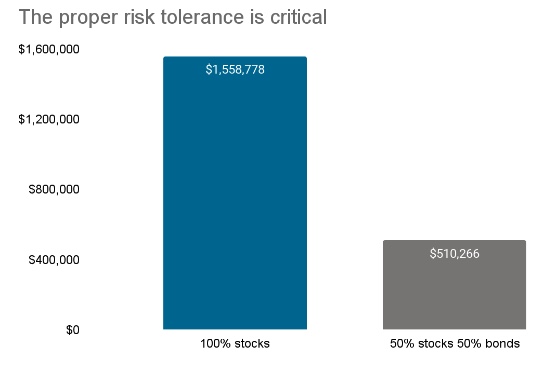
This is why Facet puts so much emphasis on getting your risk tolerance right. Say that an investor’s time horizon suggested they should be in 100% stocks, but instead, they chose to be 50% stocks and 50% bonds.
As mentioned above, the Morningstar Global Markets index was up 8.49% annually over the last 20 years. An investor with 50% in that index and 50% in the U.S. Core Bond index would have earned 5.83%.
The chart below uses the same assumptions from the previous chart, then compares the 100% stock investor to the 50% stock/bond investor.
Source: Morningstar
This is not to say that 100% stocks is the right allocation for everyone or that a 50/50 allocation might not be right for you. Rather to say that getting your asset allocation right and then sticking to it is a hugely impactful decision. Being too conservative can be just as costly as being too aggressive.
Timing (almost) doesn’t matter
Perhaps the most common reason why investors are tempted to delay investing is anxiety over losing money in the short-term.
We have written many times about the problems with trying to time the market, including the fact that the market has historically risen far more often than it falls, all of which are important to keep in mind. However it is also the case that getting the timing right of when you start investing doesn’t matter as much as you think.
Think back to elementary school math. Remember a thing called the “commutative property of multiplication?” It is simply the idea that it doesn’t matter what order you multiply numbers in, e.g., 3 x 4 x 2 equals 24 and 2 x 3 x 4 also equals 24.
This has implications for investing. To see what we mean, here’s a chart of the Global Markets index over the last 20 years ending July 31, 2023. The actual history is the blue line.
Source: Morningstar
The red and the green lines use the same yearly returns from the last 20 years but in a different order. The red line starts with the worst years and ends with the best years, while the green does the opposite. Notice that the cumulative returns are exactly the same at the end: an investor would have enjoyed a 411% return in each scenario.
Why is this? For the same reason you can multiply 2, 3, and 4 in any order and still get 24. If the market goes up 20% in one year and down 10% another year, that comes to an 8% return, no matter which comes first.
This illustration only works this well if one only invests a single lump sum at the start. If, instead, you were to put new money into the market each year, then the timing does matter.
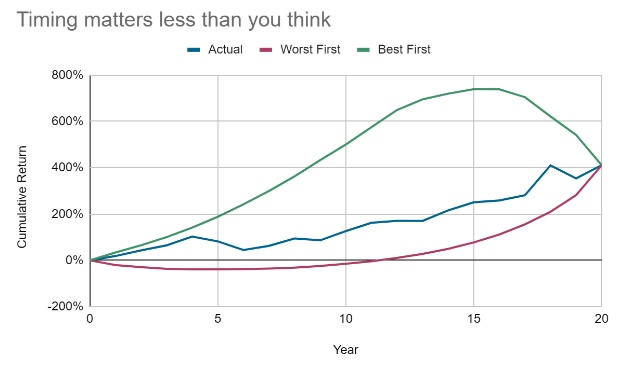
So, let’s do a slightly different experiment. Let’s use the same assumptions as our previous graphs, where one starts with $100,000 and invests another $20,000 annually.
We will also use the same 8.49% annual return over 20 years as before. However, we will also run a scenario where the investor suffers the worst return (in this case, -20% in 2008) in their first year and then gets all other years in order. In addition, we will run a scenario where the investor gets the best year (which was +34% in 2021) first.
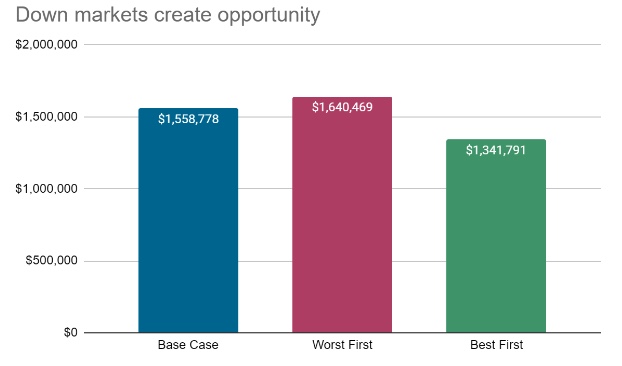
Source: Morningstar
Note that both the “worst first” and “best first” have the same set of returns, just in a different order.
It might be surprising that the investor who starts off with a -20% return winds up with more money in the end.
That’s because an investor who continuously adds money to their account gets to buy more stock after the decline, and for someone who keeps adding money, it turns out that’s a bigger advantage than starting out with a strong return.
Time waits for no one
The point of these illustrations is to show that while timing does matter, it might matter less than you think.
If you start investing today and your first year turns out to be a down year, remember that you have a long way to go. If you are someone who continues to save and invest some of your income, a down market offers an opportunity.
However, if the market is going to be up in your first year, you don’t want to delay and miss that return. If it is going to be down, you will have plenty of time to add more money and benefit from an eventual market rebound.
Finally, investors with long-term goals should remember that “long-term” isn’t the same as forever. If you delay your decision to invest by just one year, then you are one year closer to your end date.
On the other hand, if you get your money into the market, then time is on your side. If you wait, you are forgoing some of the compounding benefits, possibly making meeting your goals more challenging.