

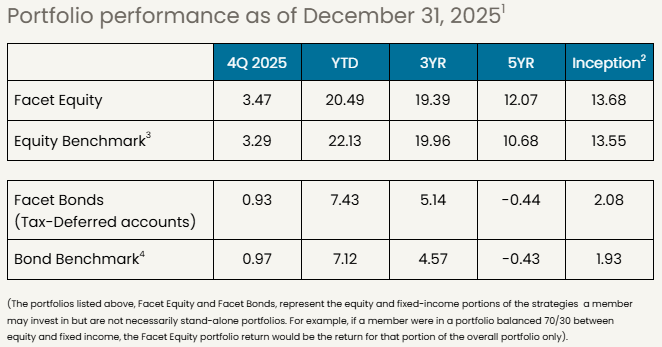
Despite some volatility, stocks managed to finish 2025 in positive territory. The Morningstar Global Markets index rose 3.29% for the quarter, marking the third straight positive quarter. The rally was broader than most of 2025, as tech stocks actually lagged modestly and smaller companies outperformed. Non-U.S. stocks put in another strong quarter, with non-U.S. developed markets outperforming both U.S. and emerging markets.
Bonds posted a solid gain for the quarter, with the Morningstar Core U.S. bond index rising 0.97%. With a 7.12% gain this year, the bond market enjoyed its best return since 2020, fueled by a combination of strong performance from corporate bonds and rate cuts from the Federal Reserve.
Facet’s equity results were slightly ahead of benchmark this quarter. The more inclusive rally in stocks helped, as did our December decision to add more to emerging markets outside of China. Our fixed income results were mixed, with our taxable bond strategy performing in-line with benchmark, while municipals outperformed.
Here are our thoughts on what happened this quarter, how it impacted your portfolio, and what we see coming next for financial markets.
If you're a current Facet member and are interested in learning more about investing with Facet, please reach out to your planner and start the conversation. The investments team is available to meet with you, answer questions, and talk through your options.
AI is big, but how big?
The artificial intelligence boom continues to be the single most dominant force in financial markets, driven by staggering levels of infrastructure investment. A study by McKinsey suggests that total spending on data centers could top $7 trillion over the next five years. This tells us that AI is going to continue to be a major force in both the global economy and financial markets.
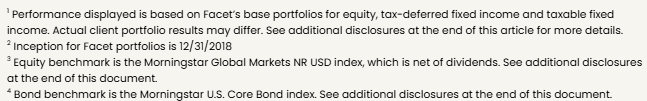
However, this quarter there was some volatility among AI-related stocks. The S&P 500 tech sector hit a high on October 29, but then dropped nearly 10% between then and mid-December before recovering a bit into year-end. Some of the AI darlings were among the stocks hit the hardest.
Source: Bloomberg
The market’s worries about AI-related stocks came from several different angles. First, there is a large set of companies that are benefiting from this spending, with semiconductor maker Nvidia being the most obvious. The current price of these semiconductor stocks assumes a blistering pace of datacenter build out. If the growth in spending were to slow down at all, there is downside to these stocks. The price of these stocks also assumes that profit margins will remain very high. If there were to be new competition in the AI chip market, for example, from Google’s Tensor Processing Units, that too could spell some downside risk to semiconductor stocks.
The second challenge is return on investment. In 2025, capital expenditures for the so-called "hyperscalers" (Amazon, Alphabet, Microsoft and Meta) reached approximately $380 billion. It is projected to grow another 25% in 2026, topping $480 billion for those four companies alone, with the growth dominated by AI spending. Profits haven’t kept up with this pace of growth. In 2023, these hyperscalers spent 40% of pre-tax profits on capital expenditures. According to Bloomberg data, In 2026 they are projected to spend 64%.
There’s nothing wrong with investing in new capabilities, of course. Tech companies can’t afford to stand still. However they aren’t likely to keep up this pace of spending if there isn’t a commensurate return on investment. In December it was reported that Microsoft was cutting sales quotes for AI-related products due to weak demand from traditional businesses. We should be careful extrapolating too much from anecdotal evidence like this, but this story does highlight that there are challenges to developing profitable AI products.
As free cash flow gets squeezed at these big tech firms, some are turning to debt to keep up the pace of AI investment spending, including announcements this quarter from Meta and Oracle. Using debt to fund capital expenditures is extremely common in the broader economy, but until now has been very rare among big tech companies. Debt levels at these companies are nowhere near worrisome levels, but the need to use debt at this stage does increase the pressure to realize a return on the investment.
The hyperscalers all have highly profitable businesses they can use to help fund these AI investments. The large language model (LLM) companies don’t have that advantage. OpenAI has signed deals to spend $1.4 trillion on datacenters over the next eight years. OpenAI will produce about $13 billion in revenue this year, but is still losing money. This means they will have to keep raising more and more money from venture capital firms and/or their suppliers. That will only be possible if OpenAI shows their products can turn a profit. If the firm is forced to scale back their spending plans, that will hit the revenue at companies like Nvidia directly.
A bubble? Or a reset?
We’re often asked by Facet members about whether there is a bubble in AI stocks. I don’t think the term “bubble” is the right one in this case. Granted there are some parallels between the current buildout of AI datacenters and the internet infrastructure buildout in the 1990’s. Back then, the internet really did change the world, but the pace of spending on things like fiber options and network switches far exceeded the demand. It is conceivable that the same thing happens with AI and datacenters.
However it is a stretch to say that financial market conditions today are comparable to the dotcom bubble era. The average price-to-earnings (P/E) ratio of the top 5 NASDAQ companies in March 2000 was 68x. Today the top 5 AI-related companies have an average P/E of 29x. In other words, Wall Street was paying more than two times the value for a dollar worth of profits in March 2000 than it is today. Between 1995-1999, there was an average of 474 initial public offerings per year. In 2025 there were less than 100.
I think today’s stock market is very enthusiastic about AI, but I don’t think it is anywhere near the ebullience of the 1990’s, and therefore I don’t think there’s the same downside.
However, given all the issues we described in the prior section, there is material risk that expectations for AI companies need a reset. According to Bloomberg, Nvidia is expected to grow earnings by 65% next year. What happens if that’s 50%? Or 40%? That’s still a torrid pace of growth, but would also probably represent material downside for the stock.
Right now we have a mild underweight on U.S. tech stocks, roughly 2.5%. We think that’s the right balance of risk and reward given this “reset” risk, but also the longer-term growth potential for the sector.
In the fourth quarter, this underweight was a slight benefit. The tech sector was up for the quarter, but lagged the overall market.
Weak job growth raises recession risk
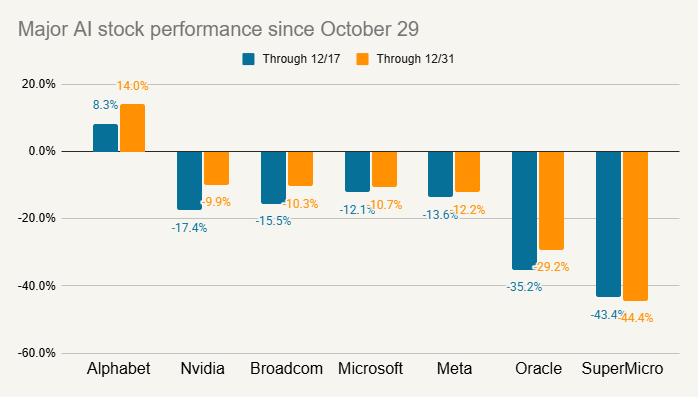
Job growth has slowed substantially in the second half of the year: now averaging just 23,000 per month in job gains since mid-year. That’s concerning because the U.S. has never experienced job growth this slow without the economy tipping into a recession. In other words, low but positive job growth has historically not been sustainable. Every other time in the past when we’ve been in this kind of situation, either job growth rebounds or it goes negative.
Source: Bureau of Labor Statistics
Why is low but positive job growth such a problem? There are probably a few reasons. One is that if job growth is poor, it indicates that business sentiment is weak. In other words, if companies were optimistic about 2026, why wouldn’t they be hiring more aggressively to expand production? When business sentiment sours, not only do firms stop hiring, they also stop spending on new equipment, new buildings, etc. A drop in this kind of business spending (called “fixed investment”) is a classic cause of recessions.
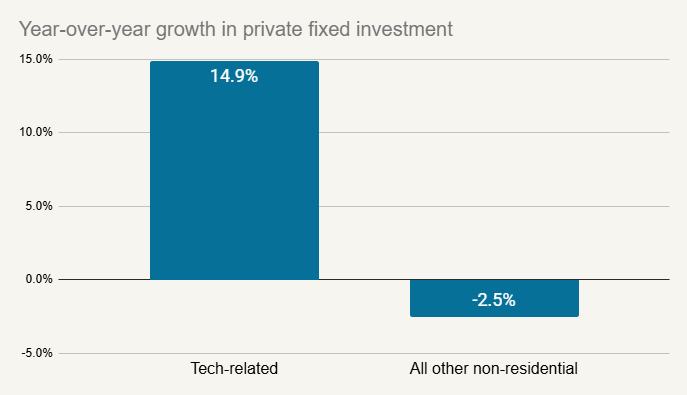
Here’s where this time could be different. Fixed investment is actually quite strong right now, growing at a 5.5% pace over the last year. This appears to be driven mostly by all the AI-related spending. If we dig into the details of the BEA’s GDP report you can see private fixed investment by category. If we sum up the “Information processing equipment” plus the “Software” categories and call that “Tech-related” we can see that accounts for more than 100% of all growth in non-residential fixed investment.
Source: Bureau of Economic Analysis
I don’t think there is anything unsustainable about this. Business spending can be very volatile, therefore it isn’t that odd that it would also be volatile within categories of business spending. Having one area strong while others are weak isn’t that strange. It is especially not that strange recently, as things like COVID and the onset of tariffs have messed with the normal inventory cycles. However, this isn’t the kind of investment that produces a ton of jobs. There are certainly construction workers involved in building a datacenter, but the single biggest cost is the advanced semiconductors. Plus once a datacenter is complete, it doesn’t require a large number of employees. Most of the operation is automated.
Soft job growth could also have implications for consumer spending. Growth in spending requires growth in income. For households to have more income in aggregate, we either need robust job growth or robust wage growth. As we showed above, we aren’t seeing much job growth, and wage growth isn’t terribly strong either. The BLS’s Average Hourly Earnings figure grew at a 3.5% clip for the 12 months ending in November. That would be the slowest annual wage growth since 2019.
There are many arguing that slow total job growth is partly a function of lack of labor supply. The crackdown on immigration has slowed labor force growth substantially. If there are just fewer new workers available, it stands to reason that the pace of job growth also has to slow. The optimistic view would be that if hiring demand were to rebound in 2026, the tight labor supply could lead to improved wage growth. However, the fact that we’re actually seeing softer wage growth right now suggests that in fact hiring demand is also weak. This is the main reason why I don’t put a lot of stock in the labor supply argument.
All this is to say that recession risk is elevated, but by no means a guarantee. While I expressed some concerns above about AI spending relative to expectations, it would be extremely surprising to see AI spending decline in 2026. That alone may be enough to forestall a recession even if hiring remains tepid. This could create an environment where some companies feel like it is a recession, even if the economy overall performs well. In that kind of scenario, you could see some more vulnerable corners of the market significantly underperform, such as non-tech small cap stocks or especially cyclical sectors. This is a big reason why Facet reduced our small cap weighting this quarter.
Fed could cut rates more in 2026
The Federal Reserve cut rates three times in 2025, but the Fed committee is somewhat divided. If we look at the so-called “dot plot” where Fed officials mark their own preference for future rate cuts, they are all over the map. Of the 19 Fed committee members, four suggested the Fed should cut rates by 0.75% or more during 2026. But seven others suggested zero cuts (or even some hikes) in the coming year.
This divide reflects a challenging environment for the Fed. Inflation remains well above the Fed’s 2% target, and forces like a lack of immigration and tariffs are probably putting some upward pressure on inflation. For some Fed officials, they are hesitant to cut rates with inflation this high. On the other hand, as we discussed above, the labor market is clearly weakening. For some on the Fed, this takes priority over solving the inflation problem.
I think the most likely outcome is that the Fed winds up cutting at least 2-3 times more. Most of the inflationary impact from tariffs has probably already been felt, and the soft wage growth mentioned previously is probably going to help ease inflation pressure. While it is true that seven Fed committee members have penciled in no rate cuts, that’s still a clear minority. I think this also shows most of the Fed is more concerned about weak labor conditions than somewhat elevated inflation.
We will also get a new Fed Chair in 2026. President Donald Trump has suggested that he knows who he is going to nominate, but won’t make the announcement until January. At one time it seemed that Kevin Hassett, a long-time economic advisor to Trump, was the clear front-runner. However, according to various reports, some of Trump’s confidants have been telling him that Hassett won’t be viewed as independent enough. At the time we’re writing this, betting markets still have Hassett as the favorite for the job, but the gap has narrowed between him and Kevin Warsh.
We’ll write more about this selection when Trump makes a formal announcement. Here we will just say that while Hassett is clearly close to President Trump, he is also a traditional economist. He knows that cutting rates too aggressively could cause more inflation, the dollar to drop, and interest rates to rise. None of that would be good for Trump politically. Bear in mind also that the Fed Chair doesn’t dictate Fed policy. Traditionally the Fed’s committee has followed the Chair’s lead, but this is simply due to precedent. Individual Fed officials are free to vote however they want on changes to rates. This means that if Hassett wants to lead the Fed effectively, he has to be seen as adequately independent.
This is a long way of saying that I don’t think the choice of Fed Chair makes a huge difference in the number of Fed rate cuts we should expect in 2026. The data is likely to support at least a couple more rate cuts regardless of who becomes Fed Chair.
“Cockroaches” in the credit markets?
JPMorgan Chase CEO Jamie Dimon stirred the pot in October with a memorable warning. Referring to the bankruptcies of Tricolor and First Brands, Dimon quipped, "When you see one cockroach, there are probably more." This comment comes at an interesting moment in the credit markets. A lot of lending that was once done by banks is now being handled in the private credit markets, including some of the loans to these two companies. This is where the loans are made directly by investment funds, such as some of the funds in Facet’s Alternative Income strategy. While private lending isn’t new, it has grown substantially over the last several years. Naturally this leads to some questions about the risks that this growth could bring.
Despite these two big defaults, there is little evidence of broader stress in private credit, or frankly anywhere else in the credit markets. Private credit covers a lot of different kinds of lending, but generally speaking, these kinds of loans are being made to private companies that are smaller than most companies that participate in the public bond market. They are also companies that would probably be rated “high-yield” if they got a rating. That is to say, these loans definitely carry some risk, and some degree of losses are inevitable.
However aggregate losses in private credit remain very low. According to Cliffwater, the total loss rate for 3Q was 0.66%, somewhat below the 1% long-term average. This is consistent with what we see in the broader credit market. The yield on high-yield bonds relative to Treasury bonds is near an all-time low. This means that bond buyers are pretty confident that credit losses will remain benign in 2026.
We don’t think you should consider the risks in private credit as fundamentally different from credit in general. If there is a recession in 2026, it is very likely that default rates will rise, both in private and public credit markets. That might mean that returns are low, or even negative, for various kinds of credit funds. In other words, we don’t think private credit carries special risks. Nor do we think private credit managers are able to magically avoid the risks inherent in the business cycle.
That being said, credit markets almost always outperform stocks in a down market. This is for the simple reason that companies have to pay their debts or face bankruptcy. Hence why we see the Alternative Income strategy as being somewhere between stocks and bonds in terms of risk.

Source: Dow Jones S&P Indices (stocks), Bloomberg Aggregate (high-grade bonds), Bloomberg Corporate High-Yield (high-yield bonds), Cliffwater (private credit)
European markets outperform again
European stocks continued their dominance in the 4th quarter, outperforming the U.S. 4.95% vs. 2.43% according to Morningstar. For the year the Eurozone index returned an eye-popping 41% vs. just 17% for the U.S. In the first half of the year, the declining dollar vs. the euro was a big driver of these returns. However that trend has eased. Since June 30, the dollar is almost exactly unchanged vs. the euro.
Rather it has been real economic strength that has been driving European stocks higher recently. The drive for Europe to build out its defense capabilities is functioning as a huge stimulus package. This has certainly put a charge into European defense stocks, which according to Bloomberg were up over 74% in 2025. But it has also boosted other sectors like construction, materials, etc.
The tailwind of this defense stimulus is likely to continue in 2026. Whether or not it is all priced into stocks already remains to be seen. However it may finally be true that after years of international markets underperforming the U.S., the two markets may be closer to being on even ground.
Chinese economy struggling, stocks following
China’s economy has faced intensified headwinds, highlighted by a sharp 13.1% year-on-year drop in industrial profits in November, the steepest decline in over a year. Domestically, the negative wealth effect from the multi-year property crisis continues to suppress consumer confidence. This shows no signs of abating, with Vanke, one of the largest Chinese homebuilders, teetering on the edge of default. Retail sales remain sluggish as households prioritize saving over spending, entrenching deflationary pressures that are eroding corporate profit margins and discouraging investment.
Beijing’s response in the last three months has been characterized by caution rather than the aggressive consumer stimulus many investors hoped for. In late December meetings, the central bank signaled a preference for "steady" support over aggressive interest rate cuts, aiming to preserve policy space and protect banking margins. While there have been some moves toward encouraging consumption, the widening trade surplus in China tells us this isn’t working just yet.
Facet has been underweight China for the last two years. For the first part of 2025, that was a significant drag on returns. For the first three quarters of 2025, Chinese stocks outperformed the U.S. 41.1% vs. 14.6%. However for the 4th quarter this partially reversed, as Chinese stocks fell 6.8% vs. a 2.4% rise in the U.S. Based on all of these economic headwinds, Facet prefers to remain underweight China. We did add some to Emerging Markets stocks this quarter as part of our shift away from stocks most exposed to U.S. recession risk. However we did so using an ETF that specifically excludes Chinese stocks.
What comes next?
We come into 2026 with an unusually wide range of possibilities. Wall Street remains optimistic. According to Factset, S&P 500 earnings growth is projected to be 15% in 2026, with all 11 sectors expected to increase profits. All 21 of the participants in Bloomberg’s Wall Street analyst survey expect stocks to rise in 2026. There are a lot of things going for the market right now: the huge tailwind of AI spending, Fed rate cuts, tax cuts taking effect in 2026, etc.
Moreover, we would generally argue your base case should be for stocks to rise every year. Over the last 50 years, stocks have been up 8 years out of 10. Trying to guess when bear markets are coming is a fool's game, in our view.
That being said, we spent most of this article talking about risks. Hence why we see the range of possibilities as so wide. Expectations for AI growth could be too optimistic, or the huge spending on AI could power the market higher. Weak job growth could portend a recession, or Fed rate cuts could revive business sentiment.
Given all this uncertainty, we think building some defense into the portfolio is the right approach. This allows you to have some degree of protection while also remaining fully invested. We believe this gives you the opportunity to capture most of the upside while avoiding at least some of the downside.
Specifically, here are a few of the tactical positions we’ve taken to add in some defense to our equity allocations.
- Overweight high profitability companies: Companies with high profit margins tend to have products their customers can’t live without. This should allow for more stable revenue generation even in an economic slowdown.
- Underweight companies with more debt: In a recession, these kinds of companies have less financial flexibility, while leverage causes profits to slide more quickly.
- Underweight smaller companies: Smaller companies tend to be less diversified, have less access to capital, historically have underperformed during recessions.
- Underweight tech: This underweight is small, only about 2.5%, but we think given risks around AI this is appropriate.
- Underweight China: Not only is the Chinese economy struggling as it is, the only bright spot is exports. If there were to be a global recession, or even if just consumer spending slows down, this could hit Chinese exports hard
Facet’s investment philosophy is to build portfolios that can perform reasonably well in various kinds of markets. To do this, we have to be constantly thinking about both opportunities and risks. We have to be thinking about the range of possible outcomes, and be prepared for any of them to come to fruition. It doesn’t mean we’ll always outperform every quarter or every year, with this year being an unfortunate example. However we do think this is the right way to consistently push our members toward our goals.
Facet’s Short-Term Strategy
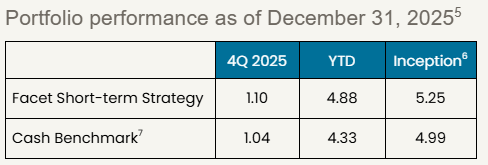
Facet’s Short-Term Strategy (STS) is designed to produce stable returns commensurate with the yields available in shorter-term bonds. The strategy is designed for members with money goals that are only a year or two away.
STS’s performance was ever so slightly ahead of the Morningstar Cash T-Bill benchmark this quarter. This was mainly due to superior income generation. Fed rate cuts have pushed the yield on all shorter-term bonds lower, but T-Bills have declined by a greater degree than the bonds in STS. Having this small income advantage should add up over time, and we think is likely to be the main driver of longer-term performance.
Facet’s Alternative Income Strategy
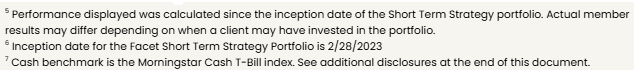
Facet launched the Alternative Income Strategy in April, so these results only reflect about eight months of performance. In that short period, the strategy is performing as we would expect. The strategy uses a combination of private credit, private real estate and some public market credit instruments to produce a high level of current income.
Alternatives are difficult to compare to a benchmark. We are using a 50% stock, 50% bond benchmark, because we believe over time, that’s about the risk profile of this strategy. However we would expect the strategy to underperform during big up years for stocks, like 2025 was, and outperform during more middling or down years.
We are focused on whether the funds are performing as we would expect, i.e., tracking the roughly 9% return implied by its income generation. On that metric, the strategy is doing very well. We expect that return stream to be very competitive with stocks over the long-term, while producing substantially less volatility.

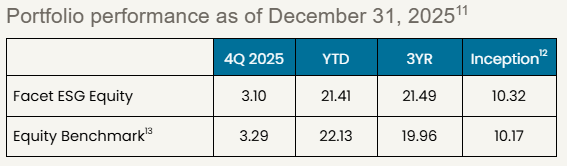
Facet’s Environmental Social Governance (ESG) Strategy
Facet’s ESG equity strategy performed about the same as the benchmark this quarter. The strategy utilizes a set of ETFs that screen out stocks based on certain ESG criteria. Specifically, the screens result in a significant underweight energy, utilities, and heavy industrial companies. By extension, that means a slightly higher weight for everything else.
For this quarter, these weighting variations didn’t make a major difference for returns. There was some outperformance from mining companies, but this was mostly offset by weaker performance from utilities. On net, the strategy wound up about even.

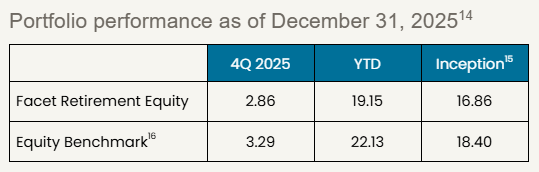
Facet’s Retirement Strategy
Facet’s Retirement Strategy is meant for members who are either already in retirement or close to it. The strategy utilizes ETFs that we expect will have relatively less volatility than our traditional growth strategy. Generally speaking, Facet expects this strategy to lag the equity benchmark a bit during big up quarters. Adding lower-volatility funds to this ETF mix should protect against the downside while giving up some upside. For members who are currently drawing on their account for living expenses, controlling volatility is of paramount concern.
The strategy was mildly behind benchmark for this quarter, about in-line with what we’d expect given the lower volatility nature of the strategy. Having a little less smaller cap stocks and a little less emerging markets in this strategy were also mild drags on relative performance.
Performance disclosure
Past performance is not indicative of future returns .Investment returns shown here are intended for illustrative purposes only. All investments involve risk, including the potential for the loss of principal. The portfolio performance of Facet strategies began in 2018. Effective December 31, 2025, Facet transitioned to use composite performance, which represents the actual asset-weighted investment experience of a group of member portfolios managed to a specific strategy. Performance results for the current quarter period are calculated using portfolio accounting software and represent actual member results (composite performance).
Calculations for the 12-month, 3-year, and Since Inception periods were performed using the Bloomberg Portfolio Analytics tool. Performance was calculated using Facet’s most common recommended equity and fixed-income ETF portfolios. At times when Facet changed a recommended ETF, the average transaction price of both buys and sells was used to update the portfolio. Otherwise, the portfolio was rebalanced monthly. This illustration is meant to most closely resemble what a common Facet member in a given asset allocation mix may have returned.
Benchmark disclosure
The Morningstar Global Markets Index NR USD and US Core Bond indices have been licensed by Facet for use for certain purposes. The services provided by Facet are not sponsored, endorsed, sold, or promoted by Morningstar, Inc. or any of its affiliated companies (all such entities, collectively, “Morningstar Entities”). The Morningstar Entities make no representation regarding such services. All information is provided for informational purposes only. The Morningstar Entities do not guarantee the accuracy and/or the completeness of the Morningstar Indexes or any data included therein. The Morningstar Entities make no warranty, express or implied, as to the results to be obtained by the use of the Morningstar Indexes or any data included therein. The Morningstar Entities make no express or implied warranties and expressly disclaim all warranties of merchantability or fitness for a particular purpose or use with respect to the Morningstar Indexes or any data included therein. Without limiting any of the foregoing, in no event shall the Morningstar Entities or Morningstar’s third-party content providers have any liability for any special, punitive, indirect, or consequential damages (including lost profits), even if notified of the possibility of such damages.