

ESG portfolio
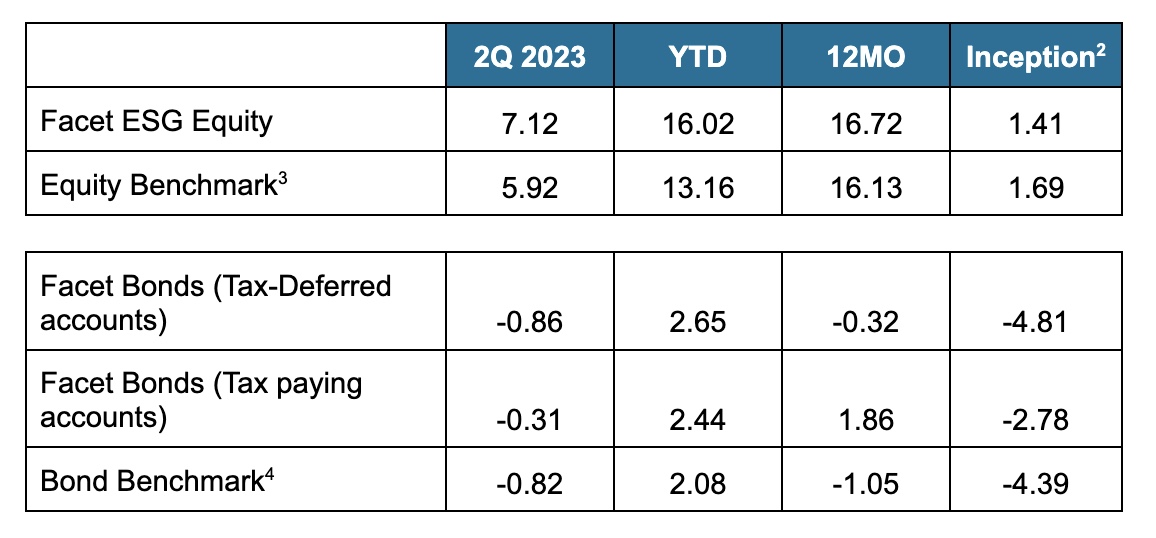
Facet’s ESG equity strategy was slightly ahead of the Morningstar Global index for the second quarter. The strategy uses ETFs that screen out stocks based on certain ESG criteria.
As a result of these screens, the strategy holds significantly less commodities exposure than the broader market. This was the biggest positive driver both this quarter and in the year-to-date period.
Commodity prices generally have fallen significantly in 2023. For example, oil prices fell 9% this quarter, aluminum down 11%, copper down 9%, etc. This strategy is underweight industries like metals mining and oil exploration, which were among the worst performing industries this quarter.
This is a reversal from last year where oil prices as well as other commodities rose substantially in the wake of Russia’s invasion of Ukraine.
If you look at the 12-month return below, you can see that any underperformance this caused last year has been offset by outperformance this year. This is a good example of how ESG screening can cause short-term performance variance, but over longer periods tends to even out.
In bonds, municipal bonds generally outperformed taxable bonds this quarter, but otherwise our ETF selections performed in-line with the index. For the year-to-date period, Facet’s small overweight of corporate bonds has helped our taxable strategies outperform.
Model portfolio performance as of June 30, 2023
Short-Term Strategy portfolio
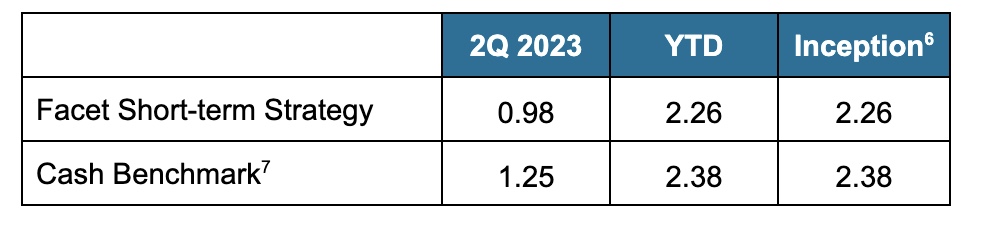
Facet’s Short-term Strategy (STS) is designed to produce stable returns commensurate with the yields available in shorter-term bonds. For the quarter, short-term bond yields surged higher as strong economic growth figures had traders rethinking how long the Fed might keep rates high. The 2-year Treasury rose by 0.87% to 4.90%. Despite that lurch higher in yields, STS produced a solidly positive return of nearly 1%.
Bond prices generally move lower as yields rise, and this was somewhat true for STS this quarter. However two factors helped insulate the strategy from volatility and allow for a positive return. The first is the simple fact that the bonds in this strategy are short-term in nature. The average maturity in this portfolio is 1.6 years. Even that overstates the interest rate risk in the fund, as ⅔ of the holdings are adjustable rate, mostly resetting each quarter. That has a similar effect as owning bonds that mature in 90 days.
The second factor is income generation. The underlying bonds owned by the ETFs in this strategy have a yield of 5.44%. This income goes a long way to offsetting minor fluctuations in prices.
That being said, the rise in rates is the reason why STS was behind the benchmark for the quarter. This benchmark is made up entirely of extremely short-term Treasury Bills. However, over the next year or so, we think having some exposure to 1-3 year bonds will be a major positive for our strategy. For more detail on your different short-term investing options, see our recent article here.
Model portfolio performance as of June 30, 2023
- Performance displayed is based on Facet’s base model portfolios for equity, tax-deferred fixed income and taxable fixed income. Actual client portfolio results may differ. See additional disclosures at the end of this article for more details.
- Inception for Facet portfolios is 3/31/2021
- Equity benchmark is the Morningstar Global Markets NR USD index, which is net of dividends. See additional disclosures at the end of this document.
- Bond benchmark is the Morningstar U.S. Core Bond index. See additional disclosures at the end of this document.
- Performance displayed was calculated since the inception date of the Short Term Strategy portfolio. Actual client results may differ depending on when a client may have invested in the portfolio.
- Inception date for the Facet Short Term Strategy Portfolio is 2/28/2023
- Cash benchmark is the Morningstar Cash T-Bill index. See additional disclosures at the end of this document.
Performance disclosure
Investment returns shown here are intended for illustrative purposes only. All investments involve risk, including the potential for the loss of principal. The model portfolio performance of Facet models began in 2018. Performance was calculated using Facet’s most common recommended equity and fixed income ETF portfolios. At times when Facet changed a recommended ETF, the average transaction price of both buys and sells were used to update the portfolio. Otherwise the portfolio was rebalanced monthly. Calculations were performed using the Bloomberg Portfolio Analytics tool. This illustration is meant to most closely resemble what a common Facet client in a given asset allocation mix may have returned. It does not represent any actual client or group of clients. The benchmark used for equity allocations is the Morningstar Global Markets Net Dividends index, which measures the performance of the stocks located in the developed and emerging countries across the world. For fixed income allocation, the benchmark is the Morningstar US Core Bond index, which measures the performance of fixed-rate, investment-grade USD-denominated securities with maturities greater than one year. We believe the sources for this data to be reliable but cannot guarantee the accuracy or completeness of the information. No consideration was given to tax loss harvesting or other activities that occur during the ongoing management of investments nor does Facet assert an opinion on the impact of these actions on these returns. These returns were calculated net of the fees associated with the underlying investments. Facet charges an annual planning fee based on the complexity of a client’s financial situation but does not charge a separate fee for investment management. The planning fee was not considered in the calculation of returns. Past performance is not indicative of future returns.
Benchmark disclosure
Bond benchmark is the Morningstar U.S. Core Bond index. Equity benchmark is the Morningstar Global Markets NR USD index, which is net of dividends. Click here for additional information and disclosure.