

For just over a year now, there has been a strange phenomenon going on in the US Treasury bond market: the yield on shorter-term bonds is actually higher than longer-term bonds. This situation is known as an “inverted yield curve” and has historically only been accurate about 15% of the time.
We first wrote about the inverted yield curve almost a year ago, and the fact that it has persisted this long is even more unusual. As of the end of August, this is the longest period the yield curve has remained inverted since 1980.
In a previous article, we covered what an inverted yield curve is and why it is sometimes considered a recession indicator. Now, we want to look at how the inverted curve should be influencing your money decisions, as well as what could be coming that may cause the curve to normalize.
How inverted is the curve?
There was only a slight inversion when we last wrote about this yield curve phenomenon in September 2022. At the time, a Treasury bond maturing in two years yielded about 3.5%, while a 10-year bond was about 3.3%. Bond traders would say that the curve is 0.2% inverted since that’s the difference between these two maturities.
Since then, the curve has become much more severely inverted. In July, the difference between these same two maturities fell to -1.08%, representing the most significant curve inversion since 1981 (it has since moderated some).
As of September 1, the 10-year yields 4.18%, while the 2-year yields 4.88%, resulting in a 0.7% inversion. We can see from the chart below that even at 0.7%, today’s curve is more inverted than other recent inversions.
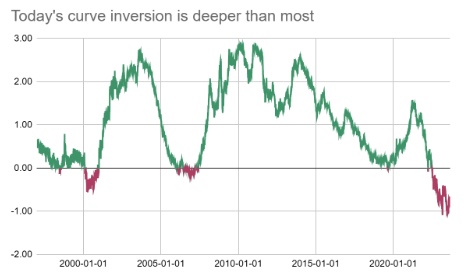 Source: Bloomberg
Treasury bond analysts tend to use the 10-year and the 2-year as the most common points when talking about curve inversion. However, if we look across all maturities of Treasury bonds, we see that the highest yields come from the very shortest securities. The chart below shows that all maturities under a year have yields over 5%.
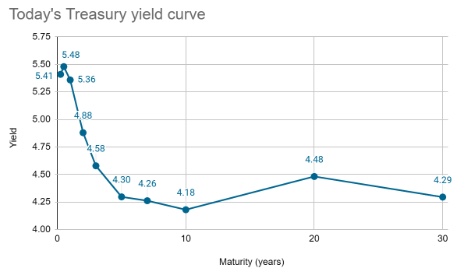 Source: Bloomberg
The Federal Reserve’s stars
The main reason why the curve becomes inverted is because investors anticipate that the Federal Reserve will be cutting interest rates at some point in the future. Check out last year’s article for more details on why that is.
One way to think about this is the concept of a “neutral” interest rate, sometimes called r-star. The idea is that if the Fed set interest rates at neutral, then they would neither be stimulating nor restricting the economy.
No one knows exactly what the neutral rate is, and it may even change over time. However, we do know that if the Fed wants to get inflation down, it has to restrict economic activity. That requires hiking rates above the neutral level. Fed Chair Jerome Powell has said repeatedly that current policy rates are “restrictive,” which tells us he thinks current rates are indeed above neutral.
Logically, the Fed isn’t going to keep rates at a restrictive level forever. So it makes sense that the higher the Fed hikes, the more investors would anticipate that the Fed eventually cuts rates back to something like neutral.
In fact, the Fed itself anticipates this too. The Fed publishes a quarterly “Summary of Economic Projections,” which includes an estimate by each Fed committee member of where they would set the Fed’s target rate for year-end 2023, 2024, 2025, and the “longer-run.” The chart below shows the median of these estimates.
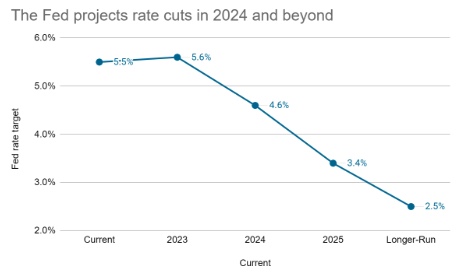 Source: Federal Reserve
Here, we see that the Fed expects its target interest rate to peak in 2023 and then start to come down.
Curve to become less inverted
Historically, the curve has reached its maximum point of inversion around the time the Fed reaches the peak of rate hikes. The curve tends to become less inverted or normalize as rate cuts get closer. Below, we show the same chart as above, but with an overlay of the Fed’s interest rate target in gray on the right-hand axis.
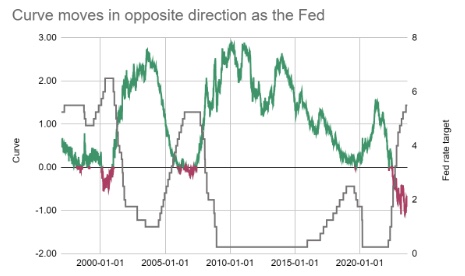 Source: Bloomberg, Federal Reserve
We have been saying for a while that we thought the Fed was either done or nearly done hiking rates for 2023. If that’s correct, and if the historic pattern shown above holds, then the curve should be becoming less inverted in the coming months. Indeed, this process has already started, with the inversion moving from -1.08% in July to -0.70% presently.
Recent economic data supports that the Fed should be about done hiking and might cut rates as soon as next year. The most recent data indicates that inflation has been slowing substantially.
In addition, recently released employment data suggests that the pace of hiring has slowed much more than was previously assumed.
The August payroll report, released on September 1, showed the economy added 187,000 jobs, which in and of itself is a solid gain. However, prior months’ estimates were revised down by 110,000.
This continues a pattern in 2023, where, so far, every month’s job estimate has been revised downward from the initial report. This includes a preliminary downward revision of 306,000 for the first quarter as part of the Labor Department’s annual benchmarking revision.
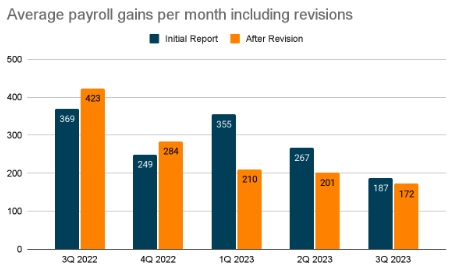 Source: Bureau of Labor Statistics
Earlier, we said that the Fed held their target interest rate above neutral, which is meant to slow economic activity and, therefore, help bring down inflation. This jobs data indicates that hiring has slowed substantially since the Fed started hiking, which should give the Fed pause. It wants rate hikes to have the intended effect but doesn’t want to slow the economy too much.
At Powell’s most recent press conference, he talked about “two-sided risks” to the economy. Namely, the risk is that inflation stays high on one hand and that the economy hits a recession on the other. We think considering both risks will prevent the Fed from hiking again in 2023 and give them room to cut rates at least somewhat in 2024.
What does this mean for my portfolio?
An inverted yield curve is often a source of confusion for investors, especially those investing in bonds. We usually buy bonds for income generation. Right now, very short-term options, including Treasury Bills, high-yield savings accounts, and even CDs, may yield the same or even higher than generalized bond portfolios.
For example, as of September 1, Facet’s standard bond ETF allocation has a yield of 5.05%. In comparison, the 3-month T-Bill yields 5.41%.*
*The Facet bond allocation is composed of fixed income ETFs which are invested in government, corporate, and other bond types. The average duration of this portfolio is 5.84.
The T-Bill is safer in a sense because, after three months, you are guaranteed your initial investment back, plus interest. As we know from the painful bond market in 2022, general bond funds can lose money.
If you have a short horizon for your investment, then something like a T-Bill or other short-term options, including Facet’s Short-Term Strategy, are excellent choices. However, if you are a longer-term investor, the high yields available now on short-term options are likely to be an illusion.
Remember that the reason why the yield curve is inverted is because investors believe short-term interest rates are going to decline. I.e., if you buy the 3-month T-Bill today at 5.41%, you will earn three months' worth of that interest rate, which is roughly 1.35%. Then, you will need to reinvest your cash.
But what happens if the interest rate available has declined or keeps declining?
You lock in some of today's high yields by owning a mix of long-term and short-term bonds, as Facet’s ETF mix does. So, if short-term interest rates start to decline, you keep benefiting with higher income generation.
The idea bears out historically. The last time the curve uninverted, the Morningstar Core Bond index returned 20.3% in the three years following the inversion, while the T-Bill index only returned 6.8%.
If we broaden this out to all years where the yield gap between the 10-year and the 2-year Treasury yield increased, there have been ten such years since 2000. On average, the Core Bond index has returned over 4% more in those years than T-Bills have.
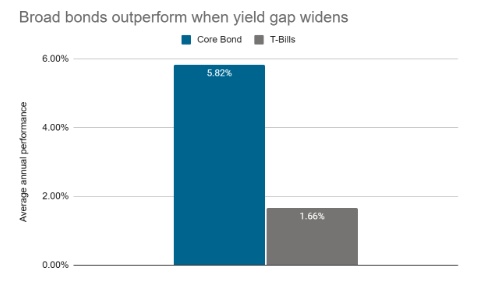 Source: Morningstar
In general, we are optimistic on bond returns looking forward, but it is certainly possible for broad bond ETFs to lose money in the short term. But if you have a longer horizon, we think it is very likely that a broad mix of bonds will outperform T-Bills or other short-term options.