Stocks rose slightly during the third quarter of 2026, with the Morningstar Global Markets gaining 1.2%. There were two big themes this quarter – AI and interest rates. We suspect these are going to remain the big themes over the next few quarters as well.
Interest rates surged this quarter on concerns about higher inflation and consequently a rate hiking cycle from the Federal Reserve. The 10-year Treasury bond yield ended the quarter at 5.29%, highest since 2002. This put significant pressure on bond portfolios, causing the Morningstar Core U.S. bond index to drop 3.4%, erasing all year-to-date gains. The rise in rates also contributed to stock market volatility.
AI stocks were mixed. Earnings growth remains extremely strong, and there were no tangible signs of the spending boom in data centers and AI equipment. However, some of the best performing stocks from the first half of the year in segments like memory, power and storage struggled this quarter, dragging down shares of those companies. Shares in sectors like software, which had struggled in the first half, staged a bit of a rebound.
Facet equity portfolios were a bit behind benchmark this quarter. This was due to a few factors which added up to modest underperformance - most notably our underweight of China, and overweight of semiconductor stocks. These were somewhat offset by some positives, including our underweight of small cap and a well-timed increase in dollar exposure, but those weren’t enough to offset the detractors this quarter. For the year, Facet’s equity strategy is well ahead of benchmark.
In bonds, taxable bond portfolios were about in-line with our benchmark. Tax-free municipal bonds underperformed significantly, as individual investors shunned bonds this quarter. This erased what had been major outperformance for municipals in the first half of 2026.
Portfolio performance as of September 30, 2026 1
| 3Q 2026 | YTD | 1YR | 3YR | 5YR | Inception 2 | |
|---|---|---|---|---|---|---|
| Facet Equity | 0.15 | 14.06 | 18.02 | 21.18 | 12.12 | 14.21 |
| Equity Benchmark 3 | 1.21 | 12.75 | 16.46 | 21.13 | 11.02 | 13.91 |
| Facet Bonds (Tax-Deferred accounts) | -3.58 | -1.65 | -0.74 | 4.68 | -0.36 | 1.65 |
| Bond Benchmark 4 | -3.44 | -2.71 | -1.77 | 4.02 | -0.64 | 1.38 |
Past performance is not indicative of future returns. Performance numbers greater than 1 year are annualized. All investments involve risk, including the potential for the loss of principal. Please see additional disclosures at the end of the article.
If you're a current Facet member and are interested in learning more about investing with Facet, please reach out to your planner and start the conversation. The investments team is available to meet with you, answer questions, and talk through your options.
Why are long-term interest rates rising in 2026?
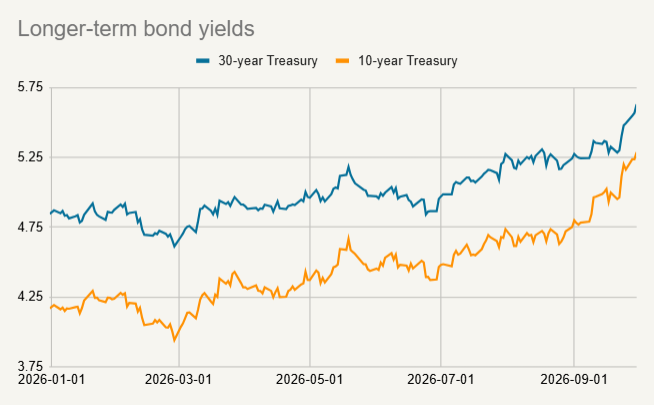
Long-term interest rates have accelerated upward since March 2026, driven primarily by surging fuel prices, expected Federal Reserve rate hikes, and massive debt-funded AI data center spending.
This trend accelerated in September. By the end of the quarter, both the 10-year and 30-year Treasury bond yields hit their highest levels since 2002.
Source: Bloomberg
There are four dominant reasons why longer-term interest rates are rising in the second half of 2026:
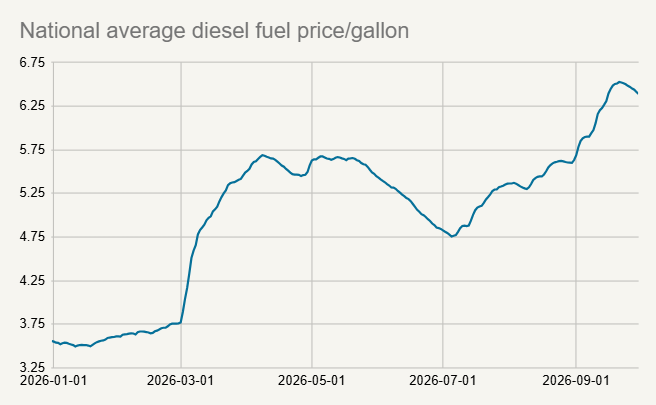
- Fuel prices have surged: Diesel prices soared during 3Q, which threatens to put additional pressure on inflation.
- Fed expected to hike multiple times in 2026: Prior to the Iran War, the Fed was expected to cut rates in 2026. Now markets are expecting 3-4 rate hikes over the next year.
- AI spending: Data center construction is mostly being funded by debt markets. This increases the supply of bonds, which tends to push up interest rates.
These factors are all inter-related. The Fed is expected to hike more in part because of diesel prices and generally stubborn inflation. The economy has gained strength in part because of AI spending, and a strong economy tends to boost inflation. However each of these factors are exerting a particular kind of pressure on interest rates, and each has different reasons why it may or may not persist into future months.
One thing we did not mention as a major driver: the U.S. deficit. This isn’t to say that the growing size of the U.S. debt doesn’t matter. It is certainly true that U.S. interest rates are higher than they would be in a world where we were running a balanced budget. However, fiscal conditions in the U.S. aren’t the key reason why longer-term rates have been rising in 2026.
Note that bond yields have been rising all around the world. Take Germany as an example, which is in a much stronger fiscal position compared to the U.S. The 10-year German government bond yield also hit decades-long highs this quarter, and has risen more rapidly than U.S. yields so far this year. We think this is very strong evidence that it isn’t the deficit or U.S. politics driving interest rates. It is predominantly those three factors mentioned above.
Could fuel and diesel prices increase inflation?
Fuel and diesel prices surged in the third quarter of 2026 largely due to ongoing geopolitical conflicts, which could place upward pressure on consumer inflation in the coming months.
Fuel prices in general rose significantly this quarter. A resolution in Iran seems increasingly distant, and Ukraine continues to damage Russia’s oil refining capacity. This hit diesel prices especially hard. According to AAA, the national average diesel price rose 32% this quarter alone, now up 80% on the year.
Source: AAA
Diesel prices may be even more impactful to consumer inflation than standard gasoline. Diesel is the primary fuel for shipping via train or truck, which means it impacts the vast majority of consumer goods at least indirectly. In recent years, companies have become much more aggressive about raising prices in response to increased costs. Before 2020, companies were generally very cautious about raising prices, which is part of why inflation was so persistently low in the 2000-2020 period. During the COVID pandemic, companies found consumers more willing to pay higher prices than was previously assumed. Since that time, companies have been more inclined to raise prices even if it risks lower unit sales.
This phenomenon is a major reason why we expect inflation will continue to be more volatile in the future compared to the pre-2020 period. It is also why we caution against assuming that the long-term correlations between bonds and stocks will persist in the coming years.
If it is true that companies can and will raise prices in the face of higher shipping costs, then it is very likely that this lurch higher in diesel prices will result in upward inflation pressure in the coming months.
How Federal Reserve rate hikes affect the bond market
The Federal Reserve's shift from anticipated rate cuts to hiking its target rate by 0.25% in September 2026 has been a primary driver behind the recent rise in long-term bond yields.
New Fed Chair Kevin Warsh resisted taking any action during his first two Fed meetings as Chair, but finally relented in September, hiking the Fed’s target rate by 0.25%. At the end of February (just before the Iran War broke out), futures markets indicated the Fed was going to cut rates three times by the end of 2027, with a reasonable chance of a fourth cut. Now futures are pricing five total hikes as the most likely path through 2027 – the one that has already happened plus four additional hikes.
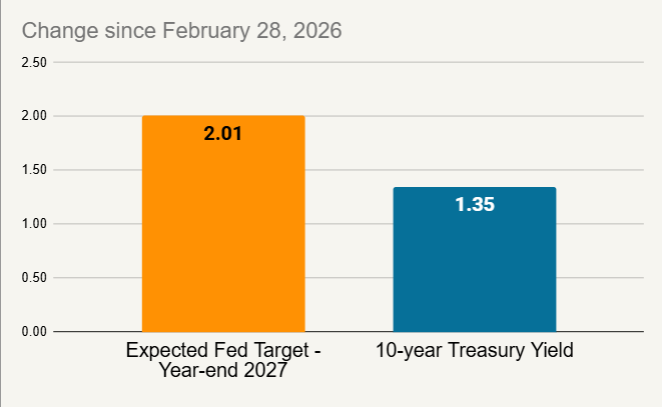
It is important to remember that long-term bond yields are mostly a function of future expectations for the Fed’s rate target. So as the expectations have shifted from cuts to hikes, logically that should have a big influence on long-term interest rates. That is exactly what has happened in 2026. The yield on the 10-year Treasury has risen 1.35% since the end of February. The expected Fed target for year-end 2027 has increased by 2.01%.
Source: Bloomberg, CME Group
In other words, the shift from Fed cuts to Fed hikes explains the entire move in longer-term bonds and then some. This emphasizes the point we made above: the economy has gained some strength and inflation has picked up, which in turn is forcing the Fed to hike rates. That is mostly what is driving rates higher.
How AI data center spending impacts interest rates
The historic boom in AI data center construction is heavily funded by debt, which increases the supply of bonds and puts upward pressure on interest rates.
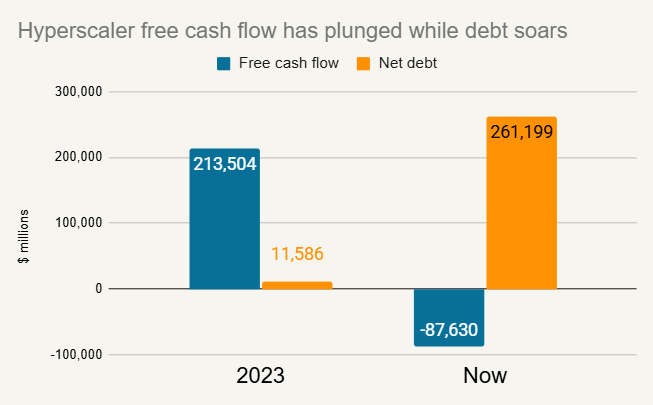
The AI build out is arguably the biggest capital expenditure boom in history, with much of the funding coming from a combination of cash from major AI firms and debt. If we look at the so-called hyperscalers, who are the biggest owners and operators of data centers, we can see how this surge in spending is impacting company financials. In the chart below, we combined Alphabet, Amazon, Meta, Microsoft and Oracle as the universe of hyperscalers. Free cash flow is cash generated from the company’s operations less capital expenditures. Net debt is total debt less cash on the company’s balance sheet. In the chart below, we compare these figures from 2023 to next year’s projected figures.
Source: Bloomberg
Combined, these companies generated about $213 billion in cash flow in 2023. Next year, these companies will spend about $88 billion more in capital expenditures than cash flow generated. By necessity, this means the companies will need outside financing, which typically comes in the form of debt. To this end, net debt for the hyperscalers was under $12 billion in 2023, but that has surged to $261 billion now.
In terms of interest rates, this massive borrowing is effectively creating more bond supply, which in turn creates some degree of upward pressure on rates. This is a textbook macroeconomic effect - a classic reason why interest rates tend to rise when the economy is strong. This factor is definitely a secondary driver of higher interest rates so far in 2026. The Fed is the main driver in our view. However, it is fair to say that as long as the boom in data center spending continues, bond yields will be somewhat higher than they would otherwise be.
Why did AI semiconductor stocks struggle in Q3 2026?
Despite strong underlying business fundamentals, AI-related semiconductor stocks experienced significant volatility in Q3 2026, which appears to have been largely driven by the forced liquidation of leveraged momentum buyers.
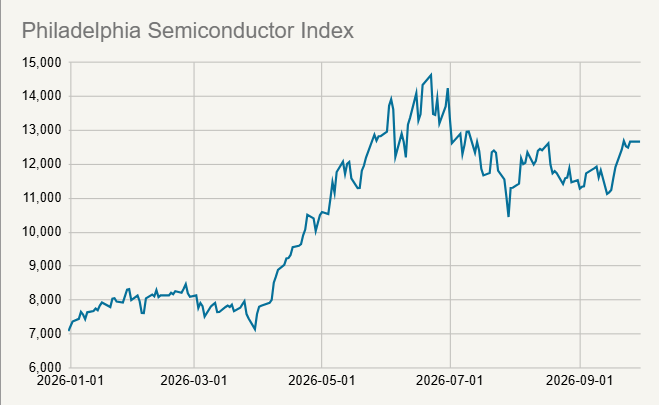
It was a wild quarter for some of the stocks that had been benefitting the most of the AI boom. For example, the Philadelphia SOX index, a widely followed index of semiconductor stocks, rose 107% from January 1 to June 22. It then fell 29% between June 22 and July 29, before recovering a bit into the end of the quarter.
Source: Nasdaq
This volatility was a major theme this quarter. Technically, the semiconductor index briefly entered a bear market, which is traditionally defined as when a stock index drops more than 20% from its peak. However, nothing really changed about the fundamentals for these stocks. There’s been no shift in growth of data centers, demand for computing power, or change in technology that catalyzed the decline in semis during June and July.
Rather, this appears to be more a classic story of stocks with very high expectations losing steam. Often when business conditions are extremely good for a set of stocks, as is the case for many of these AI-related stocks, it can attract buying from momentum buyers. These are traders who buy stocks that have recently been rising, betting that they will keep rising.
In particular, a large hedge fund called Situational Awareness had been buying huge chunks of AI-related stocks on borrowed money. The fund was forced to liquidate almost all of its stock holdings at fire sale prices in July to pack back those loans. This alone may have accounted for a material amount of the selling in AI stocks this quarter. It is probably also true that there were other leveraged momentum buyers of AI stocks who had to also liquidate, exacerbating the selling pressure. You can see on the chart above that once the selling was over in late July, most of these stocks rebounded significantly.
Facet is modestly overweight semiconductors. This is not because of any specific bet on who the winners will be in the AI race. Rather it is that we currently favor companies with high profit margins, relatively low debt, and sustained revenue growth. In the tech area, we think these companies are likely to participate on the upside should AI spending continue apace, but also weather any kind of AI downturn better than more speculative companies. It happens to be that within tech, more companies in the semiconductor industry exhibit those characteristics than other industries. Given the weakness in this industry, this was something of a detractor to relative performance this quarter.
Is the recent AI stock volatility a sign of a bubble?
While the sudden drop in semiconductor stocks highlights short-term market unpredictability, it appears to be more a result of momentum trading rather than a fundamental AI bubble bursting.
The sudden drop in semis stocks illustrates the fact that more or less anything can happen in the short-term. As we said above, with the benefit of hindsight, it seems probable that some amount of the gains in AI stocks during May and June was momentum and/or leveraged buyers bidding up prices. They then became forced sellers in July.
Stuff like this is why people sometimes call the stock market a casino. Over short time periods, stocks often move simply because there are more aggressive buyers than sellers. This is what Benjamin Graham meant when he said that in the short-term, the stock market is a “voting machine.” Stocks go up just because people vote with their dollars and want to buy more stocks.
Over longer periods, even a year or so, the market tends to be a “weighing machine” to use another Graham quote. That is to say, things like speculation or forced selling can push stocks around in the short-term, but eventually stock prices are determined by business fundamentals.
At Facet, we used a scenario-based approach to selecting investments. Our goal is to perform reasonably well across all scenarios compared to the broader market. One of the scenarios we are considering is where spending on AI infrastructure slows, dragging down a wide swath of AI-related stocks. This is the scenario where we want to have some defense built into our tech allocation. We believe that if that scenario were to play out, our underweight of less profitable, more speculative companies could help our portfolio avoid the worst of the downturn.
In other words, if there’s going to be a sustained downturn in tech stocks, it will be because something actually changes. It won’t be because people just decide to continuously sell stocks for no reason. In my decades of experience, trying to predict or chase these short-term boom/bust moments is a fool’s errand, and the best way to avoid getting caught up in these kinds of moments is to stick to a strict and disciplined investment process.
How AI safety concerns could shift tech stock winners
Growing concerns around AI safety and potential pauses in advanced model training could shift the stock market's focus, potentially benefiting inference computing companies over other tech segments.
Concerns about AI safety grew during this past quarter, culminating in a blog post from Anthropic CEO Dario Amodei where he called for “pacing” the most advanced AI training to give time for safety protocols to catch up. Within days there were reports that some of the biggest AI labs were collaborating on new safety measures, and OpenAI paused training on its most powerful models.
We wrote a longer form article on this subject, but this is a good example of how AI could continue to be a major theme, and yet the winners could shift. One possibility is that an increased focus on safety could slow the pace of training new AI models, but increase the need for inference computing power. As we detail in the article, that might benefit certain companies a lot more than others.
We sometimes hear people describe the AI trade as though it is a monolith. The reality is far more complex. The AI supply chain involves all sorts of companies, and who has been befitting most from AI capital spending has shifted over time. The winners in the stock market have similarly shifted. In 2023 and 2024, it was the owners of data centers and producers of graphical processors that were the dominant stocks. So far in 2026, the winners have been memory, storage, servers, and power.
It might be that 2027 brings another shift. Technology is always evolving. Next year’s shift in stock market winners might have something to do with a new focus on AI safety, or something else that we’re currently not seeing. We think you want to be balancing your risks. We are holding a healthy weight to tech stocks overall, but highly diversified. If the winners from AI shift, we want to make sure we own a reasonable amount of those winners as best we can. We think spreading out your holdings is the best way to accomplish this.
How did international markets perform in 3Q 2026?
Non-U.S. markets were heavily influenced by the AI trade and currency volatility, leading to mixed performance by region.
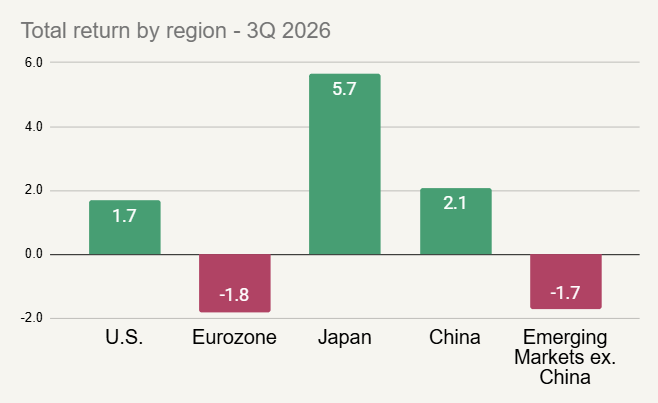
International markets were mixed vs. the U.S. this quarter. The graph below shows the total return by select regions during the quarter.
Source: Morningstar
There were several factors that drove divergent performance for non U.S. stocks during 3Q 2026.
- Fiscal challenges in Europe: The euro declined during the quarter vs. the dollar in part because of increased expectations for Fed rate hikes, but also because of worries about deteriorating fiscal conditions in Europe. This combined with some weakness from consumer stocks in Europe resulted in weaker performance vs. the U.S.
- Japanese yen surges: The yen had been weakening most of 2026, hitting a multi-decade low in July. However, currency interventions by the Japanese Ministry of Finance, plus expected additional rate hikes from the Bank of Japan, seem to have stabilized the yen. The currency rose 3.2% vs. the dollar for the quarter, boosting the return of Japanese stocks for American investors.
- Chinese stocks rebound modestly: China is one of the only major world markets to post a negative return so far in 2026, but it did get a bit of a rebound in 3Q, especially relative to other emerging markets countries. China was a bit more insulated from the 3Q semiconductor sell-off than countries like Korea and Taiwan. There were also rumors of fresh stimulus that led to some buying of Chinese stocks during the quarter, although the reality of that stimulus might not match investors’ expectations.
For Facet’s relative performance, we increased exposure to the dollar in July, which turned out to be well-timed. However our underweight of Chinese stocks relatively to the rest of emerging markets was a material drag on relative returns. We are comfortable remaining significantly underweight China. There are deep structural problems with the Chinese economy. The government has tried numerous stimulus measures, but all have either been too small or poorly targeted. Chinese AI labs have made significant progress in catching up with the U.S., but it is less clear that AI is actually turning into a profit center for Chinese companies. Being underweight China has been a big positive contributor to Facet’s results year-to-date, but not this quarter specifically.
What is the outlook for financial markets in the coming quarters?
The two big themes of 3Q 2026 – interest rates and AI – are very likely to remain the major drivers of financial markets into 2027.
Looking ahead on interest rates, we aren’t that concerned about high rates hurting the stock market overall. Our view is that as long as the economy keeps growing at a strong clip, stocks could keep performing well, even as yields keep rising. Note that since 1980, the stock market has produced an average return of 11% in years where the 10-year Treasury yield has risen at least 1%. That’s because usually when interest rates are rising by a large degree, it is coinciding with a boom in company profits. That is the case today. The growth in profits is the main driver of stocks, with things like interest rates being a secondary driver at best.
If borrowing costs stay high for the longer-term, that does create some problems for particular companies. We mentioned above that a lot of data centers are being built with debt financing. I don’t think higher yields will actually slow down AI spending, but it will make getting a strong return on data center investments more challenging. This could be a problem for more deeply indebted AI-related companies.
Higher rates also tend to be tougher on smaller companies compared to larger companies. Compared to larger companies, smaller companies have less financial flexibility, usually have shorter debt maturity windows, and are sometimes less able to raise prices in the face of higher inflation.
These are two examples of how Facet is trying to build balance into our investment strategy. We’re underweight companies with higher debt loads as well as smaller companies. I don’t know if bond yields will keep rising or not, but we think if they do, these two positionings could help provide some downside protection.
Rising rates definitely pose a challenge for bond investors. If yields keep rising, it could put more pressure on bond portfolio returns. However, there are two big caveats. The first is that it might not take that much for bond yields to stabilize. We expect longer-term bond yields to follow inflation expectations. That suggests that if the Fed can hike enough to get inflation to start coming down, bond yields could also fall. That would boost bond portfolio returns.
The second caveat is that anytime a bond yields rise, it means the forward-looking income generation of your bond portfolio is higher. The Facet taxable bond strategy had a yield of 5.58% as of quarter end, while the tax-free municipal strategy yield was 4.44%. That creates a significant cushion should bond yields keep rising.
We also think this is a time to consider alternatives. The Facet Alternative Income strategy is meant to provide some diversification in the event of rising rates and/or high inflation. This strategy wound up outperforming both stocks and bonds this quarter amidst the surge in interest rates.
In terms of AI, the situation is somewhat simpler. The buildout of AI infrastructure is the main driver of the recent surge in company profits. If AI capital expenditures continue to grow at a similar pace, stocks will likely keep performing well. If there is some kind of slowing of data center building, for whatever reason, that could spell trouble for the stock market.
This is another example of where we think balance in your investment strategy is critical. We believe you want to have a healthy weight to companies benefitting from the AI build out. After all, this could be the main driver of overall company profit growth. If you miss out on that growth, it could impair your long-term return. On the other hand, you want to have some kind of defense built into your portfolio in the event that AI spending slows.
Our approach is to be underweight companies we see as more speculative. This includes smaller companies, companies with weaker profitability, higher debt burdens, or more volatile revenue. If there were to be some kind of shakeout in the tech sector, we think these kinds of companies could underperform substantially.
By extension, being underweight these companies means we are overweight the opposite: larger, more stable, more profitable, and less indebted companies. We think these kinds of companies could generally keep up with the broader market should AI spending continue apace, but might be able to outperform other companies in a downturn.
Facet’s Short-Term Strategy
The Short-Term Strategy is focused on principal stability while aiming to provide higher income generation than typical cash-like options. The strategy uses a mix of short-term bond ETFs. For the quarter, the strategy had solidly positive returns, but modestly below the Morningstar Cash T-Bill index. This is typical of periods where interest rates surge higher, as happened this quarter. Our ETF holdings include bonds maturing between 1-3 years, which tend to underperform when bond yields rise rapidly, but outperform in steadier environments.
Looking forward, the rise in yields means the strategy is generating more yield. As of quarter-end, the estimated yield of Short-Term Strategy was approximately 4.5%, which is considerably higher than most cash-like alternatives, such as money market funds or T-Bills. We think this could provide a tailwind for this strategy going forward.
Portfolio performance as of September 30, 2026 5
| 3Q 2026 | YTD | 1YR | 3YR | Inception 6 | |
|---|---|---|---|---|---|
| Facet Short-term Strategy | 0.61 | 2.32 | 3.45 | 4.78 | 4.80 |
| Cash Benchmark 7 | 0.95 | 2.80 | 3.86 | 4.63 | 4.73 |
Past performance is not indicative of future returns. Performance numbers greater than 1 year are annualized. All investments involve risk, including the potential for the loss of principal. Please see additional disclosures at the end of the article.
Facet’s Alternative Income Strategy
The Facet Alternative Income Strategy is a mix of credit and real estate strategies which aim to provide higher income generation than bonds but more stability than stocks. The strategy is especially designed to provide diversification from traditional assets during rising rate and/or inflationary periods.
While the strategy hasn’t produced huge returns on an absolute basis over the last year, we believe it has served its purpose. The stock market has overall produced very strong returns, which makes it difficult for a more defensive strategy like this to keep up. However, during both the brief sell-off following the Iran War and during the AI stock sell-off this quarter, Alternative Income produced positive results.
More importantly, it has performed well relative to bonds during this period of rising rates. The credit strategies inside Alternative Income are almost exclusively floating rate, which means the income generation rises along with Fed rate hikes, but the price of the underlying instruments doesn’t necessarily decline in the way traditional bonds do.
Facet’s Alternative Income Strategy invests primarily in mutual funds that only allow withdrawals on a quarterly interval and may restrict the percentage of the fund that may be withdrawn each quarter. This makes the Strategy less liquid than other investments and suitable for longer term investment time frames. Additionally, these underlying funds may not be transferable in-kind to other custodians. If a receiving institution cannot hold the asset, it must be liquidated and transferred as cash, subject to the same quarterly withdrawal limits. The fees assessed by these mutual funds are greater than typical mutual funds that invest in public securities given their access to private credit and real estate investments. Given the securities held in the Facet Alternative Income Strategy, you must meet the standards of an accredited investor, asdefined by the SEC, to invest in the strategy.
Portfolio performance as of September 30, 2026 8
| 3Q 2026 | YTD | 1YR | Inception 9 | |
|---|---|---|---|---|
| Facet Alternative Income | 1.01 | 3.11 | 3.74 | 5.39 |
| 50% equity, 50% bond Benchmark 10 | -1.14 | 4.95 | 7.18 | 11.53 |
Past performance is not indicative of future returns. Performance numbers greater than 1 year are annualized. All investments involve risk, including the potential for the loss of principal. Please see additional disclosures at the end of the article.
Facet’s Environmental Social Governance (ESG) Strategy
Facet’s ESG strategy was about even with benchmark this quarter. The strategy utilizes a set of ETFs that screen out stocks based on certain ESG criteria. Generally, this strategy struggles in quarters where oil prices rise, as the funds we use screen out oil, gas, and mining companies. The Oil & Gas segment of the S&P 500 was up 51% this quarter, which certainly weighed on returns for this strategy. However this was offset by especially weak performance from other sectors that are underweight in the strategy, such as autos, transportation, and construction materials.
These factors mostly offset each other, resulting in performance about the same as the benchmark.
There are risks specific to ESG investing that should be considered before making an investment. These include a lack of long term investment history, industry and business standards that are generally undefined, a limited investment universe, and fees and expenses that may be higher than traditional investments.
Portfolio performance as of September 30, 2026 11
| 3Q 2026 | YTD | 1YR | 3YR | 5YR | Inception 12 | |
|---|---|---|---|---|---|---|
| Facet ESG Equity | 1.34 | 13.71 | 17.23 | 22.30 | 11.22 | 11.43 |
| Equity Benchmark 13 | 1.21 | 12.75 | 16.46 | 21.13 | 11.02 | 11.12 |
Past performance is not indicative of future returns. Performance numbers greater than 1 year are annualized. All investments involve risk, including the potential for the loss of principal. Please see additional disclosures at the end of the article.
Facet’s Low-Volatility Strategy
Facet’s Low-Volatility Strategy is meant for members who are either already in retirement or close to it. The strategy utilizes ETFs that we expect will have relatively less volatility than our traditional growth strategy, but perhaps less growth during big up periods. For some members, especially those near or in retirement, this trade-off can improve the overall growth and risk profile when utilized in a balanced portfolio.
Overall this strategy has done its job over the last year. It has outperformed substantially during the brief downturns we have seen, such as the start of the Iran War. The strategy is behind a general equity benchmark over the last couple years, as stocks have been aggressively higher. But it has remained close to the general market while delivering on lower volatility.
Portfolio performance as of September 30, 2026 14
| 3Q 2026 | YTD | 1YR | 3YR | Inception 15 | |
|---|---|---|---|---|---|
| Facet Low-Volatility Equity | 0.62 | 10.80 | 13.97 | 19.03 | 16.35 |
| Equity Benchmark 16 | 1.21 | 12.75 | 16.46 | 21.13 | 18.16 |
Past performance is not indicative of future returns. Performance numbers greater than 1 year are annualized. All investments involve risk, including the potential for the loss of principal. Please see additional disclosures at the end of the article.
Performance Disclosure:
For any portfolio listed above with the label Facet Equity or Facet Bonds, the results represent the equity and fixed income portions of strategy a member may be invested in but are not necessarily stand-alone portfolios. For example, for a portfolio allocated 70/30 between equity and fixed income, the Facet Equity return would represent 70% of the return on that strategy and the Facet Bonds (tax deferred accounts) would represent 30% of the return. Performance is calculated using composites and represents the actual asset weighted investment experience for member portfolios managed to a specific strategy. For an account to be included in the composite it must have at least 1 full calendar month of investment data, have a minimum account value of $5,000, and cash-flow that is less than 10%. All returns are calculated net of fees and these fees represent the fees charged for any investment in the portfolio by the underlying investment company (most ETFs). The Facet planning fee is not included in this calculation as it is for services related to planning services and investments are included without additional charge. Facet portfolios use Morningstar benchmarks which are described in detail below.
Past performance is not indicative of future returns. Investment returns shown here are intended for illustrative purposes only. All investments involve risk, including the potential for the loss of principal.
You cannot invest directly in an index.
Benchmark Disclosure:
The Morningstar Indices shown have been licensed by Facet for use for certain purposes. The services provided by Facet are not sponsored, endorsed, sold, or promoted by Morningstar, Inc. or any of its affiliated companies (all such entities, collectively, “Morningstar Entities”). The Morningstar Entities make no representation regarding such services. All information is provided for informational purposes only. The Morningstar Entities do not guarantee the accuracy and/or the completeness of the Morningstar Indices or any data included therein. The Morningstar Entities make no warranty, express or implied, as to the results to be obtained by the use of the Morningstar Indices or any data included therein. The Morningstar Entities make no express or implied warranties and expressly disclaim all warranties of merchantability or fitness for a particular purpose or use with respect to the Morningstar Indices or any data included therein. Without limiting any of the foregoing, in no event shall the Morningstar Entities or Morningstar’s third-party content providers have any liability for any special, punitive, indirect, or consequential damages (including lost profits), even if notified of the possibility of such damages.
Each Benchmark listed is a proxy selected for reference purposes only and does not reflect the actual risk profile or composition of any Facet strategy.
1 Performance displayed is based on Facet’s base portfolios for equity, tax-deferred fixed income and taxable fixed income. See Performance Disclosure above for more details. While composite performance is generally used to report on performance for Facet portfolios, individual performance could vary depending on the activities in any particular account.
2 Inception date for Facet Equity Strategy is 1/1/2019. Inception date for Facet Bonds Strategy is 5/1/2021.
3 Equity benchmark is the Morningstar Global Markets NR USD index, which is net of dividends, and measures the performance of large-, mid-, and small-cap stocks in developed and emerging markets around the world, representing the top 97% of the investable universe by market capitalization. See additional disclosures above for the Morningstar benchmark.
4 Bond benchmark is the Morningstar U.S. Core Bond index which measures the performance of fixed-rate, investment-grade, USD-denominated securities with maturities greater than one year. See additional disclosures above for the Morningstar benchmark.
5 Performance displayed is composite performance returns of Facet’s Short Term Strategy. Actual member results may differ depending on when a member may have invested in the Strategy.
6 Inception date for the Facet Short Term Strategy is 4/1/2020.
7 Cash benchmark is the Morningstar Cash T-Bill index which measures the performance of a single U.S. Treasury bill, replacing the constituent at each monthly rebalancing with a new U.S. Treasury bill that has a maturity between six and eight weeks from the purchase date. See additional disclosures above for the Morningstar benchmark.
8 Performance displayed is composite performance returns of Facet’s Alternative Income Strategy. Actual member results may differ depending on when a member may have invested in the strategy.
9 Inception for Facet Alternative Income Strategy is 5/1/2025.
10 Benchmark is 50% the Morningstar Global Markets NR USD index, which is net of dividends, and measures the performance of large-, mid-, and small-cap stocks in developed and emerging markets around the world, representing the top 97% of the investable universe by market capitalization; and 50% the Morningstar U.S. Core Bond index which measures the performance of fixed-rate, investment-grade, USD-denominated securities with maturities greater than one year. See additional disclosures above for the Morningstar benchmark.
11 Performance displayed is composite performance returns of Facet’s ESG strategy. Actual member results may differ depending on when a member may have invested in the Strategy.
12 Inception date for Facet ESG Strategy is 6/1/2020.
13 Equity benchmark is the Morningstar Global Markets NR USD index, which is net of dividends, and measures the performance of large-, mid-, and small-cap stocks in developed and emerging markets around the world, representing the top 97% of the investable universe by market capitalization. See additional disclosures above for the Morningstar benchmark.
14 Performance displayed is composite performance returns of Facet’s Low-Volatility Strategy. Actual member results may differ depending on when a member may have invested in the Strategy.
15 Inception for Facet Low-Volatility Strategy is 4/1/2021.
16 Equity benchmark is the Morningstar Global Markets NR USD index, which is net of dividends, and measures the performance of large-, mid-, and small-cap stocks in developed and emerging markets around the world, representing the top 97% of the investable universe by market capitalization. See additional disclosures above for the Morningstar benchmark.