Global stocks had the best quarter since 2020, with the Morningstar Global Markets index gaining 14.7%. The apparent cease fire in Iran caused oil prices to plunge, which helped boost stocks. In addition, U.S. companies posted exceptionally strong earnings during 2Q, especially companies related to the AI infrastructure trade.
U.S. bonds ended the quarter with slightly positive returns. The Morningstar Core U.S. bond index rose 0.7%. Falling oil prices relieved some worries about inflation, although it still seems likely that the Federal Reserve will hike rates at least one or two times later this year.
Facet’s equity results were about even with our benchmark this quarter. Our underweight of China relative to the rest of emerging markets was a positive. To a lesser extent, our focus on companies with stronger profit margins, especially within U.S. tech, was also a benefit. This was offset by some underperformance in non-U.S. developed markets as well as mid-cap U.S. companies.
Facet’s bond results were also about even with benchmark for tax-deferred accounts. However, municipal bonds had an especially strong quarter, leading to material outperformance for accounts using tax-exempt bonds.
Here we will try to answer the questions that drove markets in 2Q 2026, how this impacted Facet portfolios, as well as where risks and opportunities may lie looking forward.
Portfolio performance as of June 30, 2026 1
| 2Q 2026 | YTD | 1YR | 3YR | 5YR | Inception² | |
|---|---|---|---|---|---|---|
| Facet Equity | 14.68% | 13.89% | 26.34% | 19.88% | 11.70% | 14.69% |
| Equity Benchmark3 | 14.70% | 11.40% | 23.78% | 19.33% | 10.51% | 14.23% |
| 2Q 2026 | YTD | 1YR | 3YR | 5YR | Inception2 | |
|---|---|---|---|---|---|---|
| Facet Bonds (Tax-Deferred accounts) | 0.94% | 2.00% | 5.04% | 4.94% | 0.34% | 2.21% |
| Bond Benchmark4 | 0.66% | 0.76% | 3.81% | 4.12% | 0.04% | 1.90% |
1 Performance displayed is based on Facet’s base portfolios for equity, tax-deferred fixed income and taxable fixed income. See Performance Disclosure below for more details. While composite performance is generally used to report on performance for Facet portfolios, individual performance could vary depending on the activities in any particular account.
2 Inception for Facet portfolios is 12/31/2018.
3 Equity benchmark is the Morningstar Global Markets NR USD index, which is net of dividends. See additional disclosures below for the Morningstar benchmark.
4 Bond benchmark is the Morningstar U.S. Core Bond index. See additional disclosures below for the Morningstar benchmark.
Performance Disclosure: For the portfolios listed above, Facet Equity and Facet Bonds, the results represent the equity and fixed income portions of strategy a member may be invested in but are not necessarily stand-alone portfolios. For example, for a portfolio allocated 70/30 between equity and fixed income, the Facet Equity return would represent 70% off the return on that strategy. Effective December 31, 2025, Facet transitioned to use composite performance for the Q4 2025 results and going forward. Composite performance represents the actual asset weighted investment experience for member portfolios managed to a specific strategy. Performance results since this transition are calculated using portfolio accounting software and represent actual member results. Calculations for the 12-month, 3-year, and Since Inception periods were performed using the Bloomberg Portfolio Analytics tool. Performance was calculated using Facet’s most common recommended equity and fixed-income ETF portfolios. At times when Facet changed a recommended ETF, the average transaction price of both buys and sells was used to update the portfolio. Otherwise, the portfolio was rebalanced monthly. This illustration most closely resembled what a common Facet member in a given asset allocation mix may have returned. All returns are calculated net of fees and these fees represent the fees charged for any investment in the portfolio by the underlying investment company (most ETFs). The Facet planning fee is not included in this calculation as it is for services related to planning services and investments are included without additional charge. Facet portfolios use Morningstar benchmarks which are described in detail below.
If you're a current Facet member and are interested in learning more about investing with Facet, please reach out to your planner and start the conversation. The investments team is available to meet with you, answer questions, and talk through your options.
What were the main drivers of stock prices in 2Q 2026?
In our view, these three factors explain why stocks jumped higher during 2Q:
- Lower oil prices reduced economic risks
- Strong profit growth, exceeding investor expectations
- Improving core economic growth and job gains
When stocks have exceptionally strong quarters, such as 2Q, it can make some investors question whether the gains are sustainable. However, these are pretty healthy reasons for stocks to lurch higher. That’s not to say there aren’t plenty of risks looking forward, which we’ll cover below. But the mere fact that stocks had a monster quarter isn’t automatically cause for alarm.
How did the Iran war impact the stock market?
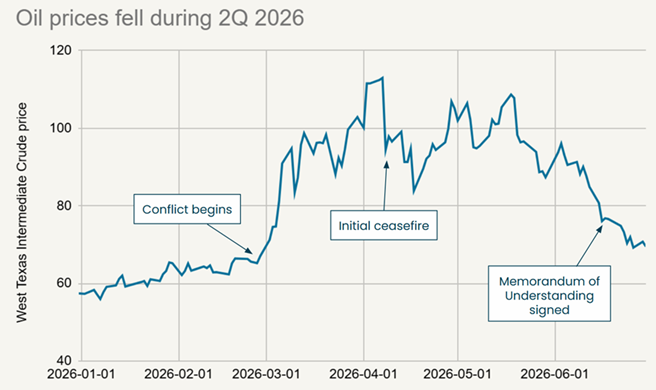
The conflict initially raised concerns over global oil supplies, but the subsequent ceasefire in April 2026 led to a significant drop in oil prices, which helped boost broader stock returns.
On March 31, President Donald Trump told reporters that the war in Iran would be wrapped up with “two weeks, maybe three.” A cease fire followed on April 8, and ultimately a formal “Memorandum of Understanding” was signed on June 17. Critically for oil prices, shipping traffic through the Strait of Hormuz had restarted as of the end of the quarter.
All of this has caused oil prices to fall from a peak of $113 in April to under $70 at the end of the quarter.
Source: CME Group
The easing of oil prices was definitely a key driver of global stocks in 2Q. While the war was going on, markets had to price the risk of a long, drawn out conflict that could have disrupted oil supply for months or even years. As that risk came off the table, it became a bit more clear how big the impact of somewhat higher oil would be on the global economy.
Oil prices are still materially higher than the start of 2026, but if oil stays in the $70-80 area, the economic impact will probably be pretty minimal. For most of 2Q, day-to-day stock market movements were highly correlated with changes in oil prices. That probably won’t be the case in the second half of the year.
How strong was the 2Q 2026 earnings season?
By many measures, it was the strongest quarter for U.S. company profits in several years.
Consider the following data from Factset:
- Most companies beat expectations: 85% reported stronger profits than expected, 81% beat expectations for revenue.
- Earnings growth broad based: 11 out of 12 major economic sectors saw earnings growth accelerate since the end of 2025. All 12 sectors saw faster revenue growth. This means it wasn’t just tech and AI driving earnings.
- Profits grew 28.8% vs. this time last year: This is a major acceleration from last quarter’s growth rate of 13.1%.
- Revenue growth 11.9%: This is the fastest pace of growth since 2022.
Ultimately, a company’s value is derived from the profits it generates. From that perspective, revenue and profit growth is the most important driver of the stock market. Moreover, a market that is being driven by profit growth tends to be a lot more durable than a market where prices are moving higher on pure speculation. I would go so far as to say it is one of the strongest earnings quarters I can recall outside of recoveries from recessions.
I would also say anytime company profit growth outpaces stock price growth, as was the case in 2Q, that tends to be a healthy sign.
Is the U.S. economy accelerating?
In addition to strong company earnings, the macro economy showed signs of acceleration this quarter as well.
Job growth was basically non-existent in 2025, averaging just 10,000 gains per month. However in 2026, hiring has recovered somewhat. For the first half of the year, job growth has averaged 92,000.
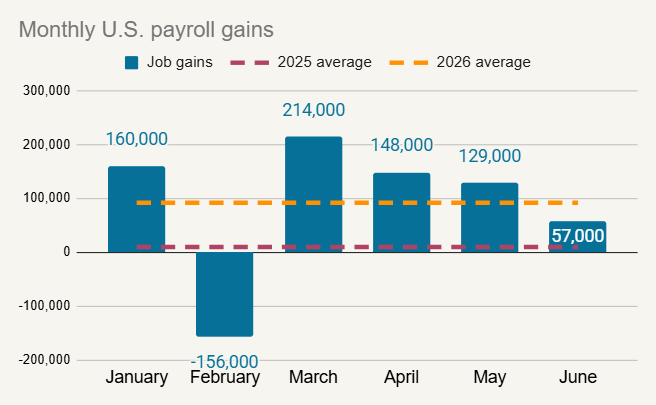
Source: Bureau of Labor Statistics
This pace of job growth is a bit on the slow side compared to history. Typically, during non-recessionary periods, total employment grows between 1-3% per year. Through June the U.S. is on pace to grow jobs at just a 0.7% pace. However, the trend certainly looks a lot better than it did at the end of 2025, and that’s good news for the economy.
Note further that there hasn’t been any uptick in the actual rate of layoffs. There have been some high-profile layoff announcements, but overall, it is still true that most companies aren’t hiring aggressively, but aren’t laying people off either. We are often asked about whether AI is impacting the labor market, and right now, it seems the impact is relatively minor, at least in the aggregate.
The improvement in job growth seems to be allowing for an uptick in consumer spending. In fact, consumer spending is currently on pace for the largest increase since 2022.
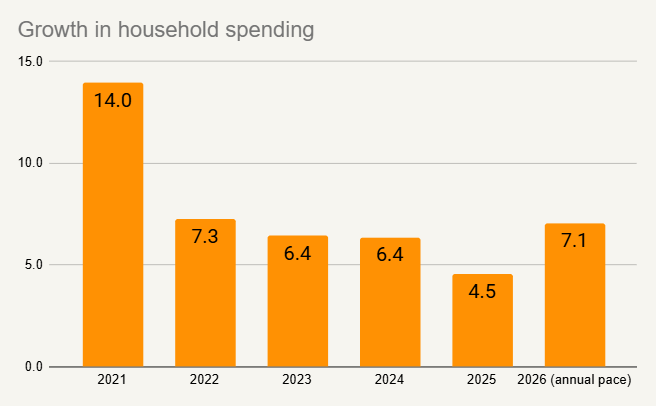
Source: Bureau of Economic Analysis
There are other signs of economic improvement. For example, the ISM Manufacturing survey, a long-standing survey that tracks growth or contraction in the manufacturing sector, tracks the pace of new factory orders. By this metric, U.S. factories are seeing the best pace of new orders since 2021.
Overall, this points to an economy that is growing at a solid pace. I wouldn’t describe this as roaring growth, but it is marked improvement from the second half of 2025.
Will the Fed hike rates in 2026?
One of the risks to both stocks and bonds could be the Federal Reserve. New Fed chief Kevin Warsh chaired his first meeting in June. While Warsh was careful not to telegraph any particular future Fed action, he did emphasize that getting inflation back to the Fed’s 2% target was a priority. He said during his press conference: “I am pleased to report that members of the FOMC are unambiguous and unanimous: This Committee will deliver price stability.”
Given where inflation is, if Warsh wants to “deliver price stability” that probably means the Fed will be hiking rates soon. As the chart below shows, Core PCE inflation, the Fed’s favored measure, is running well above its 2% target, and seems to be accelerating. Note that the “core” in Core PCE means this measure removes energy and food prices. Hence the upward trend you see in the chart isn’t a reflection of higher gas prices.
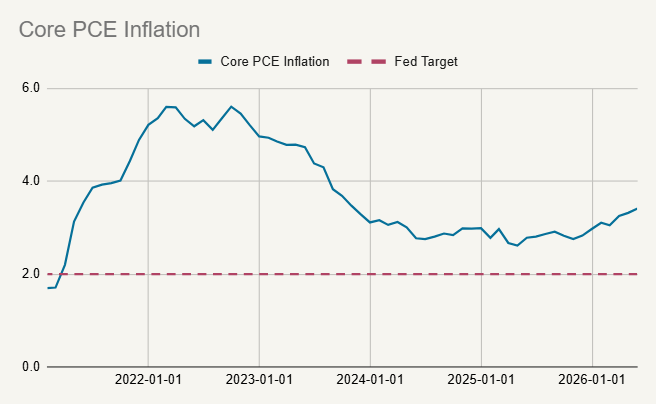
Source: Bureau of Economic Analysis
Right now the market is only expecting 2-3 rate hikes over the next several months, with some chance of rate cuts in 2027. This implies that the current consensus is that inflation won’t stay high for long, i.e., that a couple rate hikes will be enough to reverse inflation and this won’t become an elongated rate hiking cycle like we saw in 2022-2023.
As the market began to anticipate more rate hikes, this pushed Treasury bond yields higher. The 10-year Treasury yield rose from 4.32% to as high as 4.67% in mid-May before ending the quarter at 4.49%. It also caused the U.S. dollar to rebound. The U.S. dollar index finished the quarter at its strongest level since May of 2025.
How did AI stocks fare in 2Q 2026?
Broadly speaking, tech stocks had a great quarter. The “Information Technology” segment of the S&P 500 was up almost 32%, easily besting the 15% return for the whole index. However this belies a notable divergence in performance among “AI” companies.
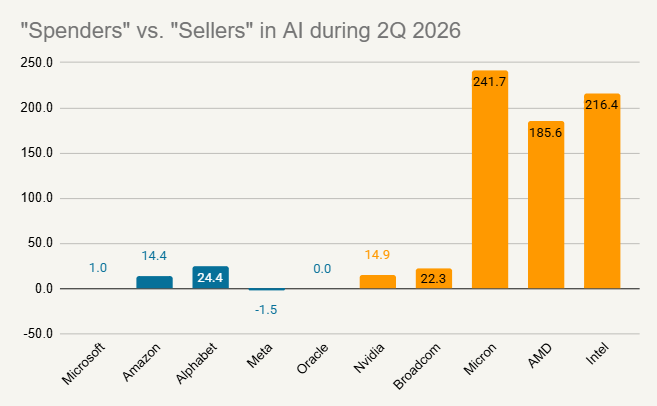
The chart below shows the ten largest U.S. companies that are directly involved in the AI trade in some fashion. We’ve divided them into “spenders” (in blue) and “sellers” (in orange).
- Spenders: These are the companies spending capital to build data centers and other AI infrastructure, sometimes referred to as “hyperscalers.”
- Sellers: These companies are selling the tech that goes into the data centers, e.g., GPUs, memory chips, etc.
Source: Bloomberg
We see here that the “sellers” in orange as a group far outperformed the “spenders” in blue. If we widened this analysis it would be even more stark. In 2Q, there were 17 companies in the S&P 500 that returned more than 100%, 15 of which would be solidly in the AI “seller” category. The same story held globally too, with companies like ASML, Taiwan Semiconductor, Samsung, and SK hynix all having huge quarters.
This tells us that the market isn’t blindly buying everything that is associated with AI. This is a healthy sign. The “seller” group has generally seen profits and margins greatly increase over the last few quarters. So the market is rewarding the companies that are actually making money. On the flip side, the mediocre returns from the “spenders” shows the market wants to actually see results, not speculatively assume big investment in data centers will produce big profits some day in the future.
Could AI stocks be a bubble?
There are definitely risks in the tech sector, and it is always possible that there will be some kind of market crash. However, I don’t think the odds of a true bubble-style crash are especially elevated right now.
Looking at the data, I still don’t think “bubble” is the right term for the risks in today’s stock market. It certainly could be that certain individual stocks, or groups of stocks, could suffer significant declines. It also could be that any slowing of data center construction could cause a reset in tech stock valuations. That being said, we don’t see many of the classic markers of a true bubble, such as unsustainable valuations, rising company leverage, or unchecked speculation. I’ll note that the price-to-earnings (P/E) ratio of the both S&P 500 overall, as well as the semiconductor segment, have declined over the last two years.
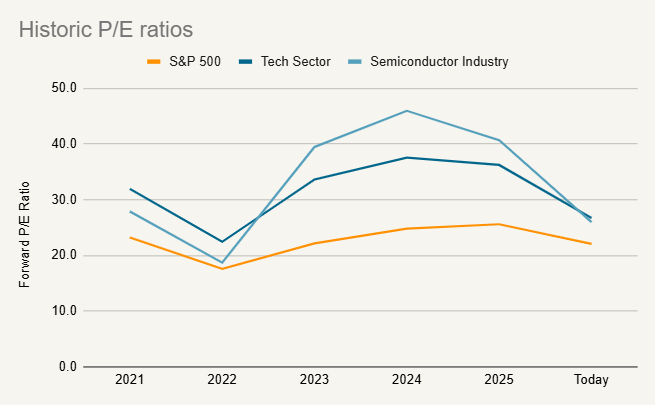
Source: Bloomberg
Facet is approaching AI stocks in a balanced way. Trying to guess the top of the market is extremely difficult to do in any circumstance. This is especially true in a market like today, where AI-related stocks are legitimately growing profits at an incredible pace. If that profit growth continues, these stocks could keep appreciating rapidly. This is upside we don’t want to miss should it come to fruition.
However, we also want to have some defense in the event that AI spending slows. We think the right way to play that balance is to be equal weight to tech overall, but tilt that exposure to more profitable companies. We think this could help us avoid the most exposed companies in a tech downturn.
This balanced approach has worked very well so far in 2026. During 1Q, when tech stocks really struggled, Facet’s primary equity strategy outperformed by nearly 2.2%. Then in 2Q, when tech stocks soared, Facet managed to keep up with the benchmark. In both periods, our overweight of companies with low debt burdens, high profit margins and steady revenue generation has allowed the tech stocks within our portfolio to outperform those in the benchmark. This in turn helped boost our overall relative return.
How did international markets perform in 2Q?
Most global markets produced strong performance in 2Q 2026, with China being the most notable exception.
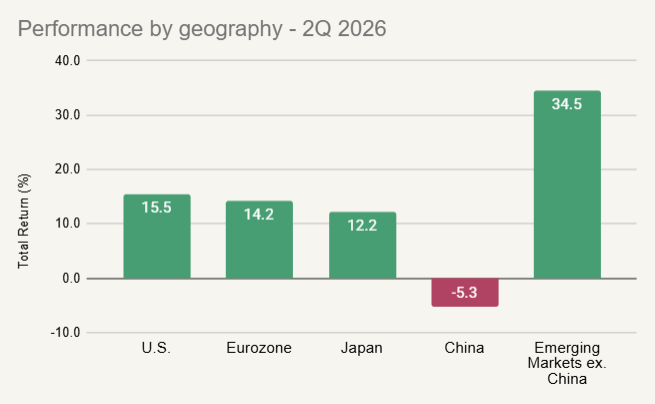
Source: Morningstar
The Chinese market has been in a kind of slow-moving crash since the middle of 2025: the Morningstar China index is now more than 20% below its 2025 peak. Several events in 2Q suggest that China’s economic malaise isn’t getting any better:
- Domestic demand weakening: Chinese retail sales dropped 0.6% year-over-year in May, the first annual contraction since COVID. Fixed asset investment, i.e., spending on structures and equipment, fell 4.1%.
- Property crisis ongoing: Defaults on household debts jumped 21% to ¥ 2.2 trillion. Estimates suggest something like 10.6% of Chinese adults are behind on debt payments.
- Unfriendly regulations, especially toward tech: Chinese regulators launched a crackdown on what they called deceptive practices aimed especially at big internet retailers such as Alibaba and Tencent. Those stocks were down 21% and 10% respectively this quarter.
- Energy prices: China got a disproportionate amount of its oil from Iran prior to the recent conflict. This came at a steep discount to the world market price for oil since few others were willing to trade with Iran. During the war, this meant that the lack of supply from Iran hurt China more so than other countries. Now that the war is apparently over and the U.S. is lifting Iranian sanctions, the price of Iranian oil will likely converge with the world price. This will result in China paying more for energy than it did previously.
Facet is underweight China, and this was a benefit during 2Q. We are about equal weight emerging markets (EM) generally, which we achieve by using an emerging markets fund that excludes China. This was also a benefit, as the rest of EM performed quite well. Part of this was strong performance from Korean and Taiwanese markets, both of which have large AI “seller” companies.
Looking forward, we’re not inclined to try to call a bottom in Chinese stocks. At some point, the Chinese economy will find its footing, and that could result in a big rebound, but for now the balance of risk and reward is tilted toward risk in our view.
What will be the major drivers of markets for the rest of 2026?
U.S. stock market performance will probably be a function of AI spending and Fed rate policy.
Probably the biggest risk the market faces is related to spending on data centers. As we said above, the “sellers” are making huge profits right now, and this is a big part of what is driving the market higher.
However, the “sellers” are only making huge profits because of all the money “spenders” are pouring into AI infrastructure. If Wall Street isn’t rewarding companies for spending to build out compute capacity, eventually those companies will stop spending so much. As we have written before, the job of a public company CEO is to get your stock price higher. Management isn’t going to keep doing things that cause their stock to languish.
Potentially exacerbating this risk is the impending IPO of OpenAI and Anthropic. Once these companies are public there could be greater scrutiny over their financials. What happens if Wall Street starts looking at these two companies with the same skepticism as other “spenders”? Note that while hyperscalers like Microsoft or Meta are currently spending huge sums on the AI build-out, these companies are also still extremely profitable due to their legacy businesses. OpenAI and Anthropic are both losing money, and therefore need to raise additional capital beyond any IPO proceeds to keep spending. That could heighten Wall Street’s skepticism.
There are some signs of potential cracks in the pace of spending on AI. OpenAI is reporting mulling cutting prices for the “tokens” used by companies to access its models. This comes as some companies, such as Uber, are saying their employees are burning through the AI budget without necessarily getting a commensurate improvement in productivity.
There are also reports that Meta will begin leasing excess compute capacity from their data centers. While this might be a good decision for Meta, it does suggest that the company has already overbuilt capacity. Will Meta and others keep spending on new data center construction if they aren’t filling existing capacity?
All of this could be part of a healthy rationing of supply for compute. For example, perhaps Meta itself doesn’t need all that data center capacity, but demand from the broader economy is more than enough to take up the excess. Maybe companies cracking down on frivolous use of AI chatbots helps us realize more robust productivity gains. That would have significant benefits for investors in all kinds of companies.
However, because of the risk of some kind of tech reset, we are comfortable with the balance we have struck within our tech positioning. We intend on remaining roughly equal weight on tech overall, while staying materially underweight smaller, less profitable, and more leveraged companies. We think those are most vulnerable should there be some kind of slowdown in AI spending.
The other big risk we see is Fed rate hikes. If the Fed does only hike a couple times in 2026, and this doesn’t cause any collateral damage to the economy, the financial markets will probably take that in stride. However, if the Fed winds up hiking more aggressively, this poses a few significant risks:
- Tech stocks: Historically faster growing stocks have been vulnerable to rising interest rates, especially those with limited current cash flow.
- Leveraged companies: The more debt a company has, the more interest costs matter for the company’s valuation.
- Bond yields: An aggressive rate hiking cycle could result in losses, especially for longer-term bonds. The losses suffered during the 2022-2023 period are highly unlikely in our view, but some degree of negative returns for bonds is a risk.
- U.S. dollar: As we have written several times, the dominant factor driving the dollar’s value vs. other currencies tends to be interest rates. The more the Fed hikes, the more likely the dollar is to appreciate. This could result in underperformance for non-U.S. investments, although that might be offset if there is weakness in tech stocks. The U.S. market is significantly more tech-heavy compared to other world markets.
Here again, we are going to keep a balanced approach. It is probably the case that Fed rate hikes will bring down inflation slowly, which ultimately would be good for the economy. However, we think our tech positioning, our general underweight of leveraged companies, and our market-weight of non-U.S. companies, could allow Facet portfolios to weather any Fed related volatility.
Facet’s Short-Term Strategy
Facet’s Short-Term Strategy (STS) is designed to produce stable returns commensurate with the yields available in very short-term bonds. The strategy is designed for members with money goals that are only a year or two away.
STS’s performance was about even with the Morningstar Cash T-Bill benchmark this quarter. In short periods, like a single quarter, the strategy tends to outperform when short-term interest rates are falling and underperform when rates are rising. Short-term rates did rise this quarter, as the market began to price in the potential for multiple Fed rate hikes. However, this modest drag was mostly offset by the superior income generation of the strategy.
The higher short Treasury yields rise, the more income the strategy is likely to generate. The yield on the strategy is 4.04% as of quarter-end. Ultimately income generation is the key driver of this strategy’s results.
Portfolio performance as of June 30, 2026 5
| 2Q 2026 | YTD | 1YR | 3YR | Inception⁶ | |
|---|---|---|---|---|---|
| Facet Short-term Strategy | 1.03% | 1.70% | 4.04% | 5.00% | 4.98% |
| Cash Benchmark⁷ | 0.94% | 1.83% | 4.02% | 4.76% | 4.80% |
5 Performance displayed was calculated since the inception date of the Short Term Strategy portfolio. Actual member results may differ depending on when a client may have invested in the portfolio.
6 Inception date for the Facet Short Term Strategy Portfolio is 2/28/2023.
7 Cash benchmark is the Morningstar Cash T-Bill index.
Facet’s Alternative Income Strategy
Facet’s Alternative Income Strategy is designed to diversify portfolios of traditional stocks and bonds by using a mix of private real estate and private credit strategies. We believe this mix should be less volatile than stocks but offer significantly more return potential than bonds. In addition, the floating-rate nature of the credit strategies tends to not be correlated to movement in interest rates, which could provide significant protection in an inflationary or rising interest rate scenario.
In periods like 2Q, where stocks produce outsized returns, this strategy is not likely to keep up. This was the case in 2Q. The strategy produces almost all of its return from income generation, which generally results in more of a slow-and-stready return stream.
That being said, we think the strategy is doing its job. The strategy has produced solidly positive returns in every quarter since the strategy was launched. If we were to go through an elongated period of weak stock returns or rapidly rising interest rates, we think the strategy could really add value to member portfolios.
Portfolio performance as of June 30, 2026 8
| 2Q 2026 | YTD | 1YR | Inception9 | |
|---|---|---|---|---|
| Facet Alternative Income | 1.29% | 1.71% | 4.79% | 5.34% |
| 50% equity, 50% bond Benchmark10 | 7.60% | 6.16% | 13.59% | 15.59% |
8 Performance displayed is based on Facet’s Alternative Income Strategy.
9 Inception for Facet Alternative Income portfolio is 5/30/2025.
10 Benchmark is 50% the Morningstar Global Markets NR USD index, which is net of dividends, and 50% the Morningstar U.S. Core Bond index. See additional disclosures below for the Morningstar benchmark.
Facet’s Environmental Social Governance (ESG) Strategy
Facet’s ESG equity strategy was a solidly ahead of benchmark this quarter. The strategy utilizes a set of ETFs that screen out stocks based on certain ESG criteria. Specifically, the screens result in almost no weighting to oil producers and refineries. That tends to mean the strategy struggles in short periods where oil prices rise, but outperforms when oil prices fall.
As we discussed above, oil prices plunged during 2Q. This caused energy-related stocks to underperform, reversing much of the gains they enjoyed in 1Q.
Energy stocks are subject to these kinds of wild swings in response to commodity prices. However if we look longer-term at the strategy’s results, you can see that these swings tend to even out over time.
Portfolio performance as of June 30, 2026 11
| 2Q 2026 | YTD | 1YR | 3YR | 5YR | Inception12 | |
|---|---|---|---|---|---|---|
| Facet ESG Equity | 17.16% | 12.21% | 24.59% | 20.14% | 10.72% | 11.72% |
| Equity Benchmark13 | 14.70% | 11.40% | 23.78% | 19.33% | 10.51% | 11.43% |
11 Performance displayed is based on Facet’s ESG strategy.
12 Inception for Facet ESG portfolios is 3/31/2021.
13 Equity benchmark is the Morningstar Global Markets NR USD index, which is net of dividends. See additional disclosures below for the Morningstar benchmark.
Facet’s Low-Volatility Strategy
Facet’s Low-Volatility Strategy is meant for members who are either already in retirement or close to it. The strategy utilizes ETFs that we expect will have relatively less volatility than our traditional growth strategy. Generally speaking, Facet expects this strategy to lag the equity benchmark a bit during big up quarters. However, quarters like this one, where stocks decline substantially, should be strong quarters for the strategy relatively.
This pattern played out as expected this quarter. With stocks surging, our lower volatility funds are very unlikely to keep up. That is an intentional tradeoff.
For retirees, controlling volatility is extremely important, but it must be balanced with also getting enough growth in your portfolio to keep up with inflation and your draw rate. Lower volatility equities can be part of how you strike that balance. The strategy still has upside similar to equities, but could help avoid the worst of deeply negative markets.
Portfolio performance as of June 30, 2026 14
| 2Q 2026 | YTD | 1YR | Inception15 | |
|---|---|---|---|---|
| Facet Low-Volatility Equity | 10.96% | 10.12% | 19.58% | 17.58% |
| Equity Benchmark16 | 14.70% | 11.40% | 23.78% | 19.33% |
14 Performance displayed is based on Facet’s Low-Volatility Strategy.
15 Inception for Facet Low-Volatility portfolio is 6/30/2023.
16 Equity benchmark is the Morningstar Global Markets NR USD index, which is net of dividends. See additional disclosures below for the Morningstar benchmark.
Performance Disclosure: For any portfolio listed above with the label Facet Equity or Facet Bonds, the results represent the equity and fixed income portions of strategy a member may be invested in but are not necessarily stand-alone portfolios. For example, for a portfolio allocated 70/30 between equity and fixed income, the Facet Equity return would represent 70% off the return on that strategy. Effective December 31, 2025, Facet transitioned to use composite performance for the Q4 2025 results and going forward. Composite performance represents the actual asset weighted investment experience for member portfolios managed to a specific strategy. Performance results since this transition are calculated using portfolio accounting software and represent actual member results. Calculations for the 12-month, 3-year, and Since Inception periods were performed using the Bloomberg Portfolio Analytics tool. Performance was calculated using Facet’s most common recommended equity and fixed-income ETF portfolios. At times when Facet changed a recommended ETF, the average transaction price of both buys and sells was used to update the portfolio. Otherwise, the portfolio was rebalanced monthly. This illustration most closely resembled what a common Facet member in a given asset allocation mix may have returned. All returns are calculated net of fees and these fees represent the fees charged for any investment in the portfolio by the underlying investment company (most ETFs). The Facet planning fee is not included in this calculation as it is for services related to planning services and investments are included without additional charge. Facet portfolios use Morningstar benchmarks which are described in detail below.
Benchmarks: For each portfolio, Facet chooses a benchmark that best represents Performance disclosure
Past performance is not indicative of future returns. Investment returns shown here are intended for illustrative purposes only. All investments involve risk, including the potential for the loss of principal. The portfolio performance of Facet strategies began in 2018. Effective December 31, 2025, Facet transitioned to use composite performance, which represents the actual asset-weighted investment experience of a group of member portfolios managed to a specific strategy. Performance results for the current quarter period are calculated using portfolio accounting software and represent actual member results (composite performance).
Calculations for the 12-month, 3-year, and Since Inception periods were performed using the Bloomberg Portfolio Analytics tool. Performance was calculated using Facet’s most common recommended equity and fixed-income ETF portfolios. At times when Facet changed a recommended ETF, the average transaction price of both buys and sells was used to update the portfolio. Otherwise, the portfolio was rebalanced monthly. This illustration is meant to most closely resemble what a common Facet member in a given asset allocation mix may have returned.
Benchmark disclosure
The Morningstar Global Markets Index NR USD and US Core Bond indices have been licensed by Facet for use for certain purposes. The services provided by Facet are not sponsored, endorsed, sold, or promoted by Morningstar, Inc. or any of its affiliated companies (all such entities, collectively, “Morningstar Entities”). The Morningstar Entities make no representation regarding such services. All information is provided for informational purposes only. The Morningstar Entities do not guarantee the accuracy and/or the completeness of the Morningstar Indexes or any data included therein. The Morningstar Entities make no warranty, express or implied, as to the results to be obtained by the use of the Morningstar Indexes or any data included therein. The Morningstar Entities make no express or implied warranties and expressly disclaim all warranties of merchantability or fitness for a particular purpose or use with respect to the Morningstar Indexes or any data included therein. Without limiting any of the foregoing, in no event shall the Morningstar Entities or Morningstar’s third-party content providers have any liability for any special, punitive, indirect, or consequential damages (including lost profits), even if notified of the possibility of such damages.