Key takeaways
- The Morningstar Global Markets index rose 5.92% in the second quarter, marking the third consecutive quarter of positive performance and bringing year-to-date results to 13.16%
- The US economy has regained strength during Q2 despite concerns about inflation, recession, rate hikes, bank failures, the housing market and commercial real estate
- Inflation has remained stubbornly high, though it is receding at a slow pace
- The concentration of returns in only a few sectors means that technology, telecommunications, and consumer discretionary account for almost 80% of the total return in stocks year-to-date
- While the Fed has announced a pause in rate hikes, US Treasury bonds have suffered their first quarterly loss with the yield curve currently inverted
- Emerging markets have lagged significantly, particularly Chinese stocks, due to a slowing economy and supply chain disruptions resulting in underperformed commodities markets
- Clarity on the Fed's monetary policy and confidence in earnings growth are necessary for a lasting bull market
The second quarter was another strong one for stocks.
The Morningstar Global Markets index rose 5.92%, marking the third consecutive quarter of positive performance, bringing year-to-date results to 13.16%.
There is a saying on Wall Street that stocks “climb a wall of worry.”
The phrase stems from the fact that there’s always something to worry about.
Even in a bull market, it will feel like the market is lurching from one worry to another, making it difficult to understand how stocks can keep rising.
And yet, they still climb the wall of worry. As each concern subsides, or turns out not to be as big of a deal as feared, stock prices rise, little by little, until we look back and see that it was a bull market all along.
This year has been no different. We’ve worried about inflation, recession, rate hikes, bank failures, the housing market, commercial real estate, the debt ceiling, the dollar in decline, student loan repayments, and more.
And yet here we are, with stocks up solidly on the year.
Here are our thoughts on second quarter performance and where we think markets will go from here.
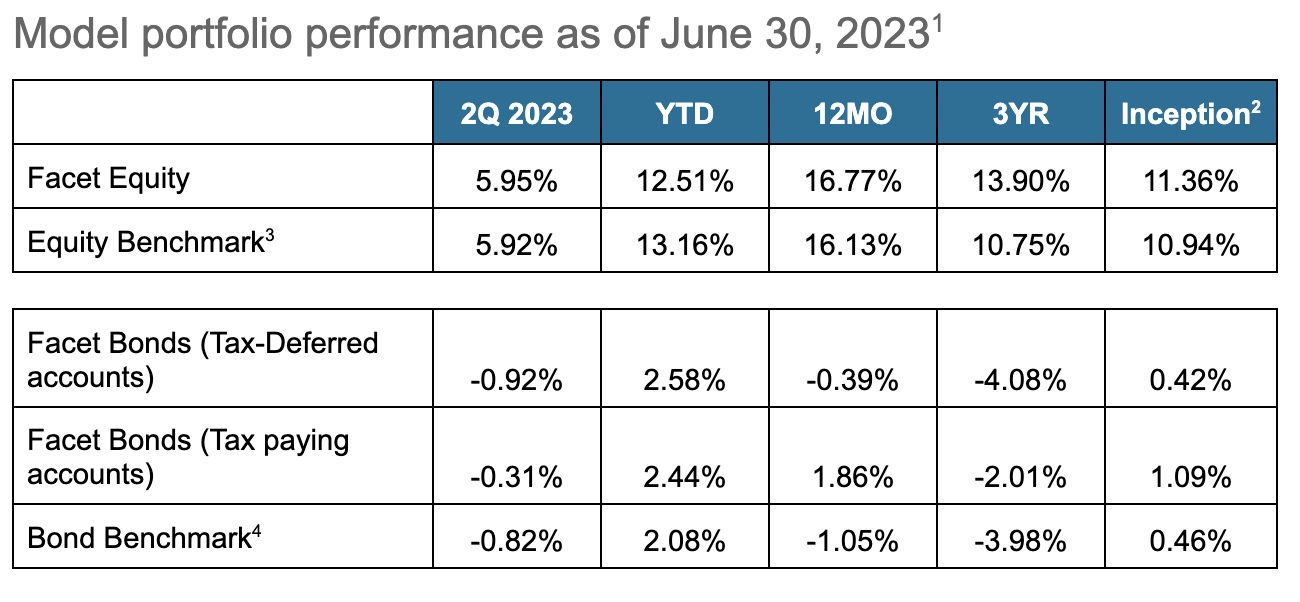
See a more in-depth view of Facet's Short-Term savings and ESG portfolio performance here.
(The portfolios listed above, Facet Equity and Facet Bonds, represent the equity and fixed income portions of the models a member may invest in but are not necessarily stand alone portfolios. For example, if a member were in a portfolio that was balanced 70/30 between equity and fixed income, the Facet Equity model return would be the return for that portion of the overall model only).
Economy firming, inflation stubborn
In our last quarterly performance update, which was fresh off the collapse of Silicon Valley Bank, it looked like the economy was at risk of slowing further. Instead, based on just about any measure you want to use, the economy has regained strength during 2Q. All figures are percentage changes unless noted otherwise.
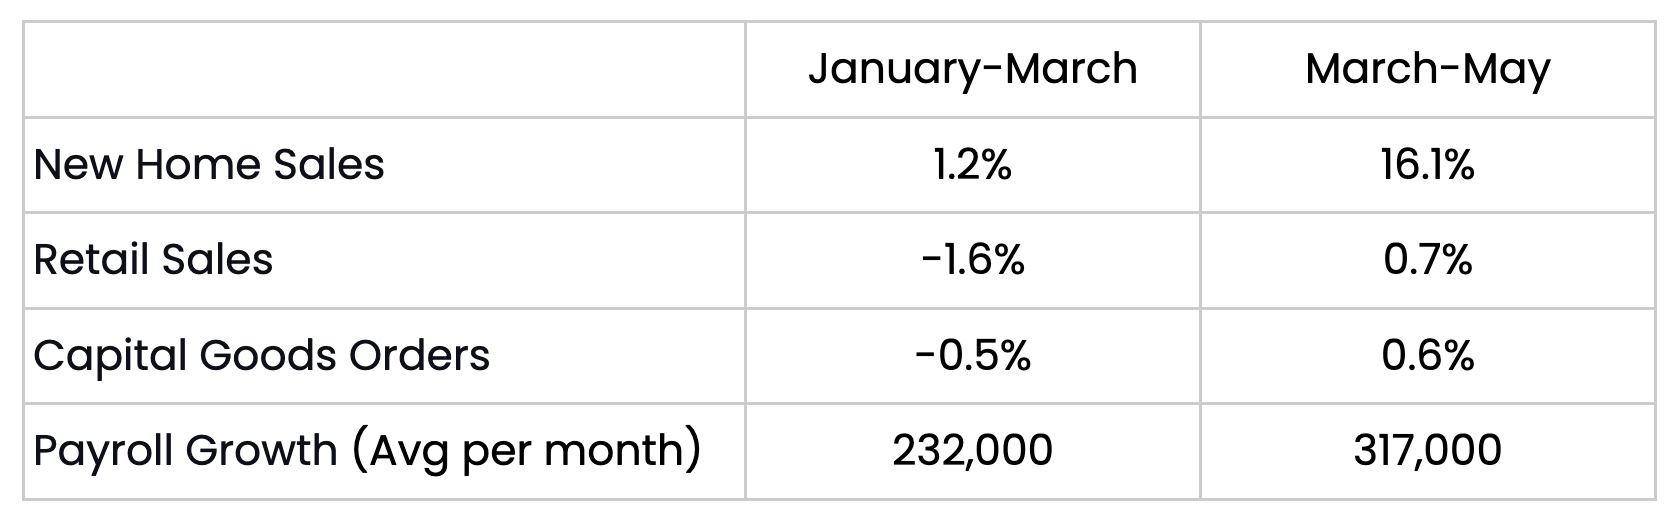
Sources: Census Bureau, Bureau of Labor Statistics, Bureau of Economic Analysis
The economy has slowed a good bit since the Federal Reserve started hiking rates early last year. All of the figures above are running much slower than they did in the first half of 2022. But it is fair to say that the economy has turned out to be much more resilient to rate hikes than most economists assumed a year ago.
Meanwhile, inflation stayed stubbornly high this quarter, likely because the economy rebounded.
Source: Bureau of Labor Statistics
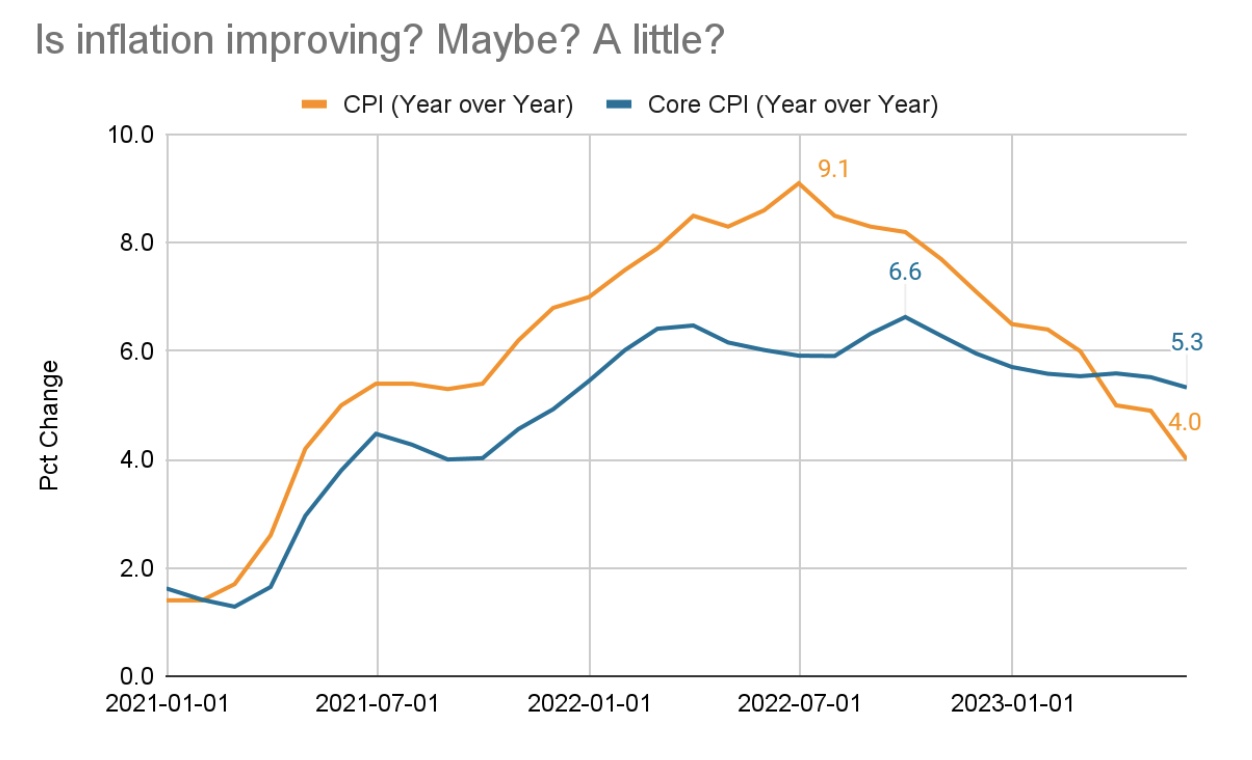
The Consumer Price Index (CPI) did fall to 4.0% in the most recent release (orange line above), a big improvement from the peak of 9.1% in the middle of last year. The problem is that most of that improvement is related to falling gas prices. If we exclude food and energy, known as “Core” inflation (blue line), prices have risen by 5.3% over the last year. It does appear to be moving lower but at a very slow pace.
However, it is notable that inflation is receding at all, given how strong the economy has been. For months Fed Chair Jerome Powell told us that the economy would need to slow and the jobs market would need to soften before inflation would subside. While it is true that economic growth and job creation have slowed from their pace a year ago, many economists assumed that we’d need a recession before inflation declined meaningfully. So far, that hasn’t been necessary.
Markets have taken notice, which is a big reason stocks are up so much this year. The market’s focus has shifted from almost solely worrying about Fed rate hikes to now celebrating that the economy is still growing. To see what we mean, consider the performance of the S&P 500 on the days when the US jobs report was released.
Source: S&P, Bureau of Labor Statistics, Bloomberg
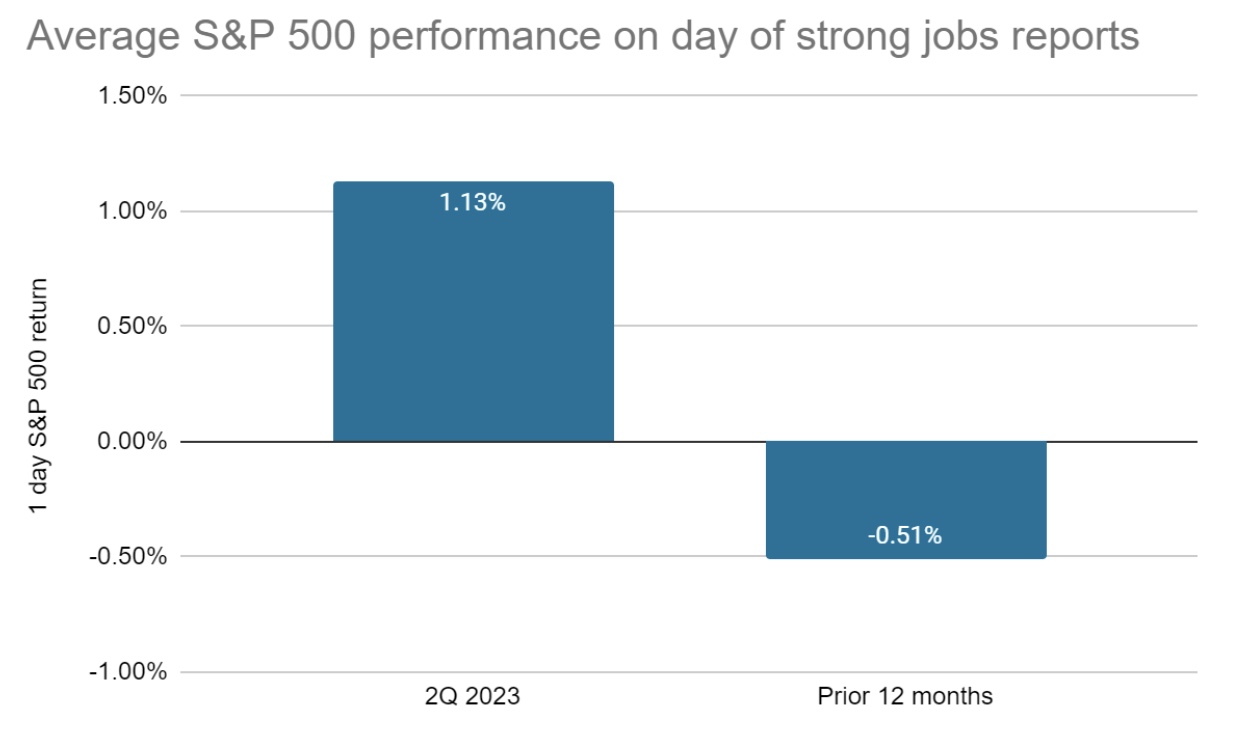
This chart shows the average daily performance of the S&P 500 on days when the jobs report was stronger than expected.
For example, if Bloomberg’s economist survey suggested expectations of 200,000 jobs, but the actual number was 300,000, what did stocks do that day?
We had three such days in 2Q, and stocks rose all three times, averaging a 1.13% gain. In the prior year, the opposite was true. There were 11 such days during that period, and stocks fell in 9, averaging -0.51% overall.
In 2022, markets figured that more jobs meant more inflation which meant more Fed rate hikes. Now markets see that inflation is subsiding without large job losses, which has changed the mentality. Now job gains are seen as validating that the economy is less likely to go into recession, and therefore company earnings can keep growing at a strong pace.
Returns narrowly focused on a few sectors
While the stock market overall was up this quarter, looking below the surface, there were relatively few winners.
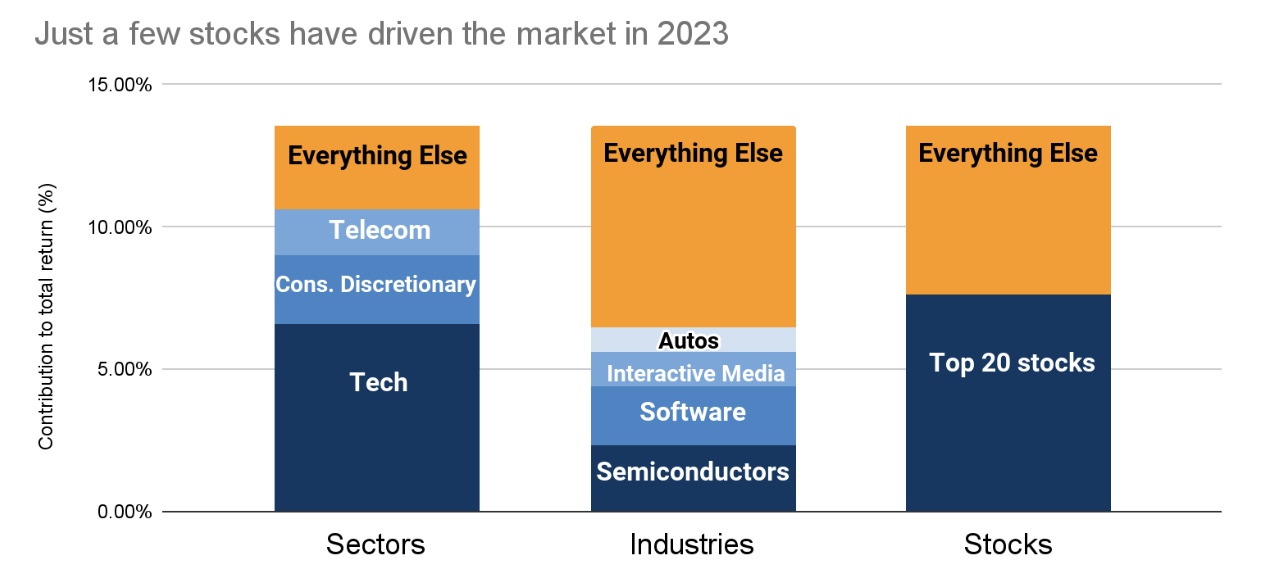
Similar to the first quarter, technology, telecommunications, and consumer discretionary (which includes things like apparel, autos, home improvement, and restaurants) were the big winners.
Year-to-date, those three sectors account for almost 80% of the total return in stocks.
There’s a similar pattern if you go one layer down and look at the industry level: the top four industries account for about 50% of returns.
Even if you look at individual stocks, the top 20 contributors added over 8% to returns, and the other 7,911 securities only added another 6%.
Source: Morningstar Indexes
So is this kind of concentration good or bad? It is really neither, but it does tell us something about the current market environment.
The reason why sectors like software and “interactive media” (mostly companies that make money on online advertising, such as the parents of Google and Facebook) are performing so well is that investors expect a big rebound in cloud computing and online ad spending in 2023 into 2024.
In addition, semiconductor companies are outperforming in markets that expect a big increase in spending on artificial intelligence, which requires high-powered semiconductors to operate. The AI boom is also helping to boost software companies as well.
Underperforming sectors this year include financials and real estate, both sectors held back by rising interest rates. Utilities and consumer staples are also underperformers, seen as struggling to grow and exposed to higher costs via inflation.
Toward the end of last year, we were writing that we expected the market to shift its focus in 2023. In 2022, inflation and the Fed were the dominant factors in stock returns. We believed 2023 would be about which companies could show resilient earnings growth. In other words, a return to core equity fundamentals, where relative profit growth drives stock performance.
This is exactly what has happened. While it has resulted in a pretty narrow set of stocks driving performance, we would argue that this is a healthy sign that investors are rewarding the companies that are producing the best fundamentals.
Facet’s relative returns were both helped and harmed by the narrowness of the market in 2Q. We are positioned to protect portfolios against two major outcomes:
- Interest rates stay high because of strong economics
- The economy slows down, and possibly slips into recession
In 2Q, recession protection stocks were mostly underperformers, as mentioned above. This was a minor drag on Facet’s portfolios relative to the broad market. Specifically, Facet’s ETF mix winds up with our portfolios owning fewer consumer companies, and these were some of the best performers in 2Q.
On the other hand, Facet’s ownership of ETFs with more predictable growth companies has resulted in an overweight in industries like semiconductors and internet advertising, which were big outperformers.
On net, along with our emerging markets underweight discussed below, the result was almost exactly the same as our equity benchmark.
Emerging markets lag
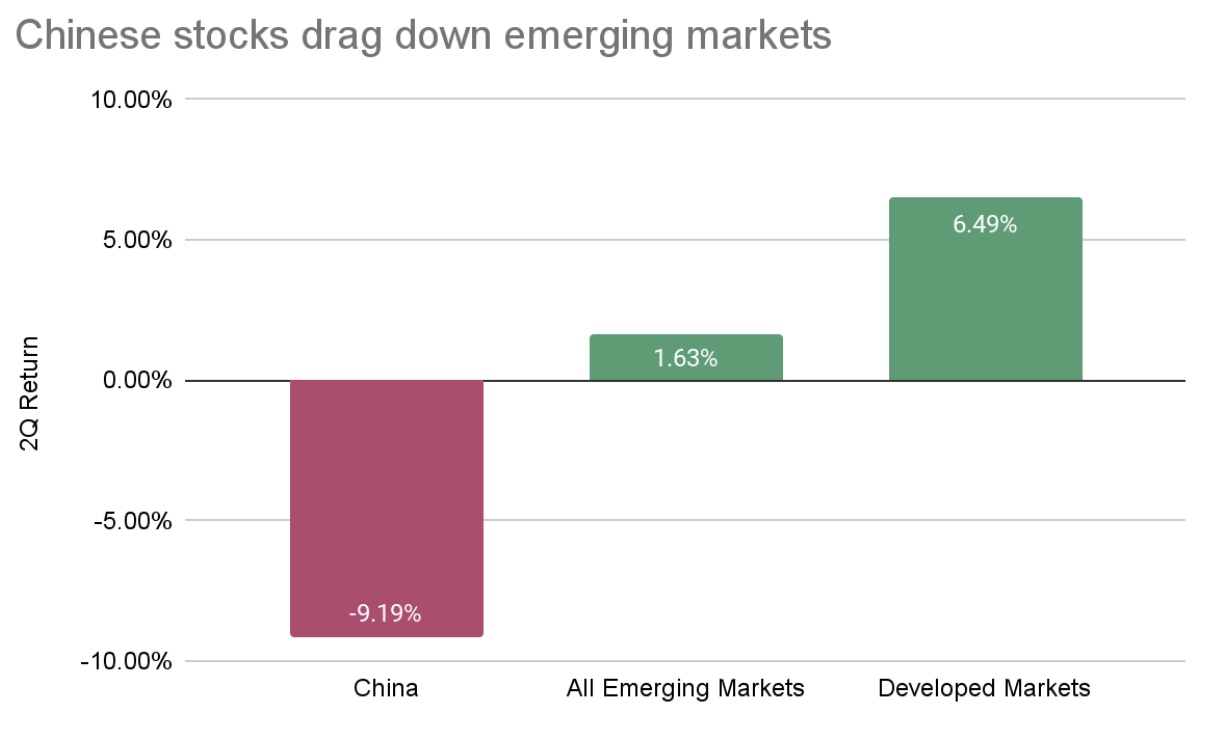
Non-US stocks were mixed this quarter. For example, developed countries (such as Western Europe, Japan, and Canada) performed similarly to the US as a group. However, emerging markets lagged significantly, with Chinese stocks creating the biggest drag.
Source: Morningstar Indexes
China is facing a lot of challenges. Much of the country’s growth over the last couple of decades has come from property development. That worked well as China was urbanizing rapidly, but now that has slowed, and as a result, construction spending has fallen off.
In addition, many companies in developing countries are looking to “friendshore” their supply chain. This recently coined term is the process of sourcing more of a company’s manufacturing and materials from politically friendly countries. This approach stemmed from supply disruptions after Russia invaded Ukraine and has hit China especially hard.
More broadly, weakness in Chinese construction and their economy has been felt in the commodities markets. For example, oil prices fell 9% this quarter, aluminum was down 11%, and copper dropped 9%. This has also weighed on emerging markets economies, as many are major exporters of these commodities.
Facet is currently underweight emerging markets stocks. We think it may take time for China to work through its economic challenges. Moreover, it has historically been true that emerging markets have underperformed substantially during periods where rich country economies slow, even if that doesn’t turn into a recession.
We think the risk in emerging markets outweighs the upside potential and warrants a lower weighting. This underweight was the biggest single positive contributor to Facet’s relative performance in equity portfolios this quarter.
Fed pauses hikes, but interest rates broadly rise
US Treasury yields broadly rose this quarter. The 10-year Treasury rose from 3.47% to 3.84%, while the 2-year rose from 4.02% to 4.89%. As a result, broad bond indices suffered their first quarterly loss since 3Q 2022, with the Morningstar Core Bond index falling 0.82%.
Notably, Treasury rates rose despite the Fed announcing a pause in rate hikes, which might surprise some readers. The reason has everything to do with the rebound in economic strength we discussed above.
Coming into this quarter, futures markets indicated that traders were expecting between two and three rate cuts in the back half of 2022. With how strong economic data has been recently, those expectations have vanished. Hence longer-term bond yields are on the rise.
Similar to what we said above about stocks, it is a healthy sign that bond yields are reacting to economic fundamentals. In part, Facet uses bond allocations as a diversifier for members’ equity allocation.
In 2022, those two assets tended to move together, which makes it a poor diversification tool. So far in 2023, bonds have returned to their normal pattern of outperforming on days when stocks are down and underperforming on days when they are up.
During this quarter, we made a change to our bond allocations for members with tax-deferred accounts. We increased our allocation to bonds maturing between three and seven years while decreasing the allocation to bonds longer than ten years.
The US yield curve is currently inverted, a term for when shorter-term bonds carry a higher yield than longer-term bonds.
This phenomenon is common toward the end of Fed rate hiking cycles but tends to last only briefly.
Usually, as the yield curve normalizes, bonds in the three to seven-year part of the curve are the best performers, and hence why we have moved to overweight that part of the curve.
This change had minimal effect on relative performance in 2Q for bonds. For qualified accounts, the performance of our bond allocations was very similar to the benchmark for the quarter, whereas for non-qualified accounts, the general outperformance of municipal bonds resulted in somewhat better relative performance.
Looking forward
For a while now, we have been saying that two things would be required for there to be a lasting bull market in stocks. The first would be clarity on how high the Fed might hike rates. The second would be more confidence in the pace of earnings growth into 2024 and beyond.
This was a good quarter on both accounts. While we don’t know if the Fed is done hiking or not, markets have become much more confident that the Fed will be done soon. Stock prices can deal with high-interest rates as long as the Fed becomes more predictable. For the moment, that is precisely what is happening.
On earnings growth, as we said above, the market is separating out the companies with quality growth and those without. In addition, the market has gained much more confidence that business spending won’t collapse, a fear that plagued markets in 2022.
We already mentioned the rebound in companies related to cloud computing or online advertising, but this has also helped boost stocks in various industries such as construction and materials.
Does this mean an overall economic slowdown is less likely? We have been warning about recession risk for a while, and as we said above, we have positioned portfolios in part to protect somewhat against a slowdown.
We think it is premature to dismiss the risk of a slowdown entirely. The reality is that economic activity is a lot lower than it was a year ago.
Markets are celebrating the fact that the economy has slowed less than feared, but it has slowed. Perhaps it will turn out that this is a declining trend, albeit a slow-moving one.
If this slowing trend continues, even if we don’t slip into a recession, it will have many of the same impacts as a recession. I.e., the kinds of companies that should outperform in a recession would also outperform in a mild slowdown, just not by the same degree.
Another major unknown is how the Fed feels about the pace of inflation improvement.
We know it felt good enough to pause rate hikes in the June meeting, but Chair Powell has been vague about how much further progress on inflation he needs to see to forestall future hikes. We would guess that another hike in July is very likely, but beyond that, it is very much up in the air. There remains some risk that inflation progress stalls and the Fed is forced to ramp up rate hikes once more.
Facet’s approach to allocating portfolios is to focus on the optimal balance of risk and reward. Within our ETFs, we are overweight companies with high-profit margins, low debt burdens, and relatively consistent earnings growth.
These should be the kinds of companies that are somewhat defensive should the economy slow. They are also the kinds of companies that are better equipped to handle an extended period of higher interest rates, higher inflation, or both. In addition, we think remaining underweight emerging markets provides further protection against a developed economy slowdown. We believe that this combination gives our members the best chance of meeting their long-term goals while protecting partially against short-term volatility.
- Performance displayed is based on Facet’s base model portfolios for equity, tax-deferred fixed income and taxable fixed income. Actual client portfolio results may differ. See additional disclosures at the end of this article for more details.
- Inception for Facet portfolios is 12/31/2018
- Equity benchmark is the Morningstar Global Markets NR USD index, which is net of dividends. See additional disclosures at the end of this document.
- Bond benchmark is the Morningstar U.S. Core Bond index. See additional disclosures at the end of this document.
- Bond benchmark is the Morningstar U.S. Core Bond index. See additional disclosures at the end of this document.
Performance disclosure
Investment returns shown here are intended for illustrative purposes only. All investments involve risk, including the potential for the loss of principal. The model portfolio performance of Facet models began in 2018. Performance was calculated using Facet’s most common recommended equity and fixed income ETF portfolios. At times when Facet changed a recommended ETF, the average transaction price of both buys and sells were used to update the portfolio. Otherwise the portfolio was rebalanced monthly. Calculations were performed using the Bloomberg Portfolio Analytics tool. This illustration is meant to most closely resemble what a common Facet client in a given asset allocation mix may have returned. It does not represent any actual client or group of clients. The benchmark used for equity allocations is the Morningstar Global Markets Net Dividends index, which measures the performance of the stocks located in the developed and emerging countries across the world. For fixed income allocation, the benchmark is the Morningstar US Core Bond index, which measures the performance of fixed-rate, investment-grade USD-denominated securities with maturities greater than one year. We believe the sources for this data to be reliable but cannot guarantee the accuracy or completeness of the information. No consideration was given to tax loss harvesting or other activities that occur during the ongoing management of investments nor does Facet assert an opinion on the impact of these actions on these returns. These returns were calculated net of the fees associated with the underlying investments. Facet charges an annual planning fee based on the complexity of a client’s financial situation but does not charge a separate fee for investment management. The planning fee was not considered in the calculation of returns. Past performance is not indicative of future returns.
Benchmark disclosure
The Morningstar Global Markets Index NR USD and US Core Bond indices have been licensed for use for certain purposes by Facet. The services provided by Facet are not sponsored, endorsed, sold, or promoted by Morningstar, Inc. or any of its affiliated companies (all such entities, collectively, “Morningstar Entities”). The Morningstar Entities make no representation regarding such services. All information is provided for informational purposes only. The Morningstar Entities do not guarantee the accuracy and/or the completeness of the Morningstar Indexes or any data included therein. The Morningstar Entities make no warranty, express or implied, as to the results to be obtained by the use of the Morningstar Indexes or any data included therein. The Morningstar Entities make no express or implied warranties, and expressly disclaim all warranties of merchantability or fitness for a particular purpose or use with respect to the Morningstar Indexes or any data included therein. Without limiting any of the foregoing, in no event shall the Morningstar Entities, or Morningstar’s third party content providers have any liability for any special, punitive, indirect or consequential damages (including lost profits), even if notified of the possibility of such damages.